Author: Coverage Mastery

  • The Insurance Coverage Gaps Most Americans Don’t Know They Have Until It’s Too Late

    The Insurance Coverage Gaps Most Americans Don’t Know They Have Until It’s Too Late

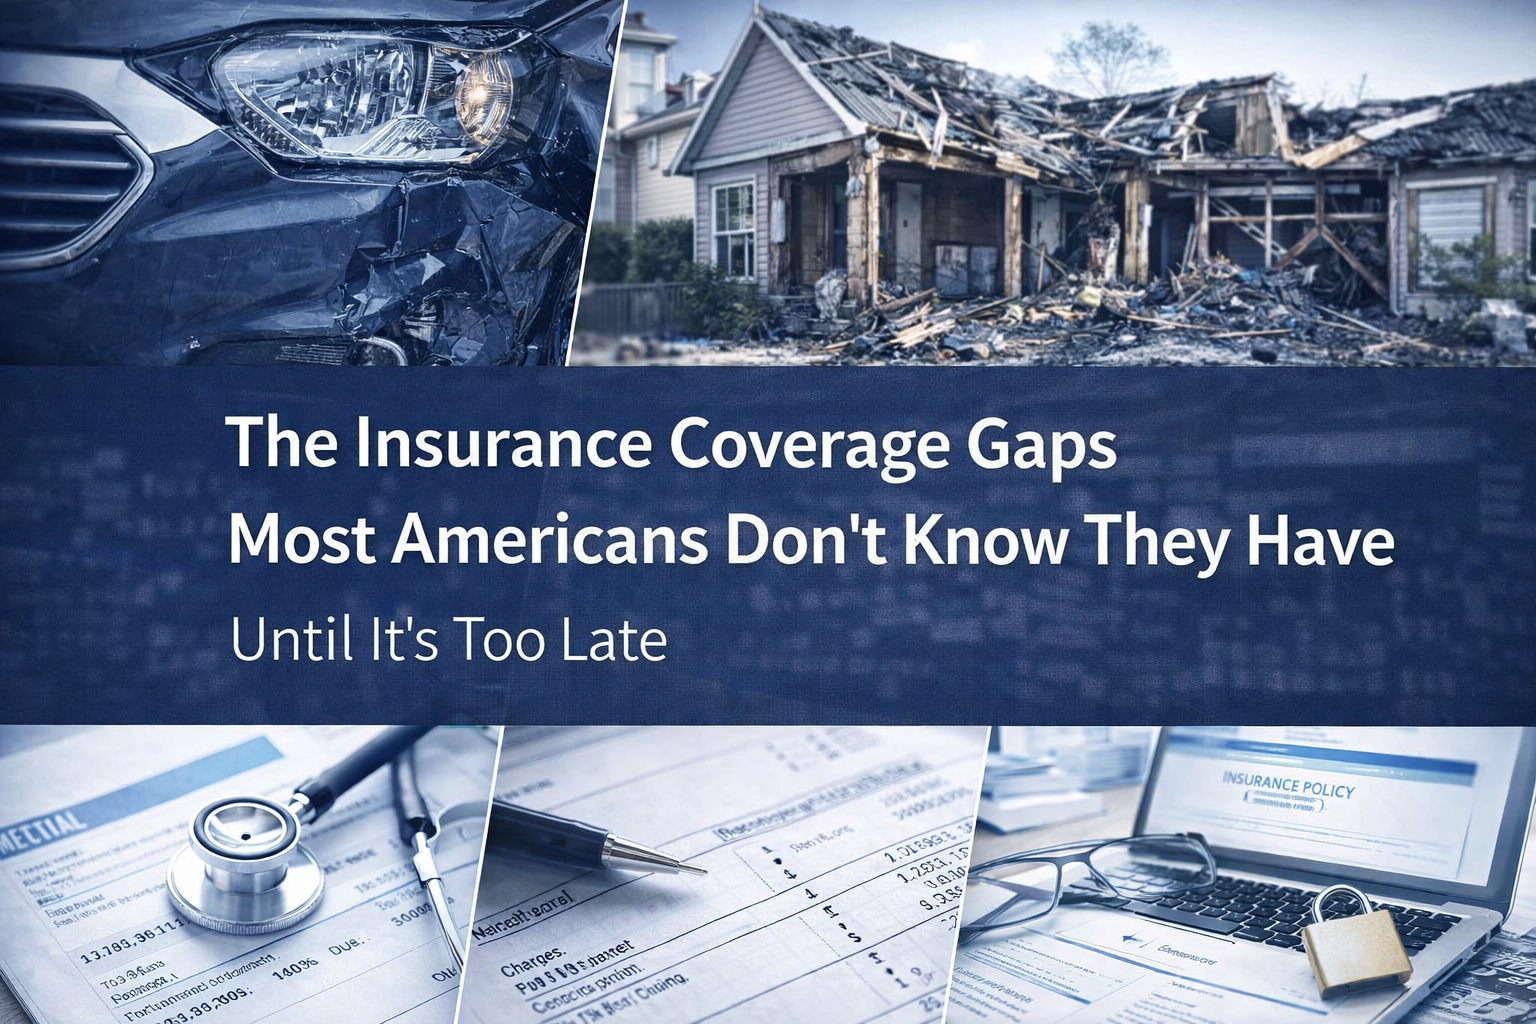
    The most expensive insurance problem is not the coverage that was never purchased — it’s the coverage that was purchased under the assumption that it addresses a specific risk when it actually doesn’t. The gap between what most people believe their insurance covers and what it actually covers exists across every insurance category, persists across every income level, and produces financial consequences that are most severe at the worst possible moment — when a significant loss has already occurred and the discovery that the coverage doesn’t apply is simultaneous with the financial impact of the uncovered loss.

    This guide covers the specific coverage gaps that appear most consistently across American households and businesses — not the obscure edge cases that require unusual circumstances to produce harm, but the gaps that arise from standard policy structures, standard coverage assumptions, and the standard failure to verify that the coverage purchased actually addresses the risk the policyholder believes it does.


    The Flood Gap That Affects Millions of Homeowners Who Don’t Know They’re Exposed

    The flood exclusion in standard homeowners insurance is the most consequential coverage gap in American personal insurance — measured by the number of households affected, the financial magnitude of uninsured flood losses, and the consistency with which the gap surprises policyholders who believed their homeowners coverage addressed water damage from any source.

    The mechanics of the gap are straightforward — standard homeowners policies cover water damage from sudden and accidental internal sources, including burst pipes and appliance failures, but explicitly exclude coverage for flood damage defined as water inundation from external surface water sources. A burst pipe that releases water into the basement is covered. A storm that produces overland flooding that enters the same basement through the foundation is not covered — regardless of how similar the resulting damage appears and regardless of how many years the policyholder has paid homeowners premiums in the belief that water damage is a covered peril.

    The geographic scope of flood risk that exceeds what most homeowners acknowledge is the factor that makes this gap most consequential. The Federal Emergency Management Agency’s flood maps designate high-risk flood zones that trigger mandatory flood insurance requirements for federally backed mortgages — but approximately 40% of FEMA flood insurance claims come from properties outside designated high-risk zones. The homeowner outside the high-risk zone who is not required to carry flood insurance and who hasn’t purchased it voluntarily faces the same financial exposure from a flood event as the high-risk zone homeowner without the regulatory prompt to address the gap.

    The solution — a separate flood insurance policy through the National Flood Insurance Program or a private flood insurer — is accessible and affordable relative to the exposure for most properties outside high-risk zones. The NFIP policy that provides $250,000 in dwelling coverage typically costs $500 to $1,500 per year for low to moderate risk properties — a modest premium relative to the financial exposure of an uninsured flood loss.


    The Earthquake Gap That Extends Far Beyond California

    The earthquake exclusion in standard homeowners policies applies nationwide — and the perception that earthquake risk is exclusively a California concern produces a coverage gap for millions of homeowners in the seismically active regions outside the West Coast that most people don’t associate with earthquake risk.

    The New Madrid Seismic Zone — which runs through parts of Missouri, Illinois, Tennessee, Arkansas, Kentucky, and Mississippi — produced some of the most powerful earthquakes in North American recorded history in the early nineteenth century and continues to generate seismic activity that USGS monitoring confirms. The Wasatch Front in Utah, the Charleston area of South Carolina, the Pacific Northwest outside California, and parts of the intermountain West all carry earthquake risk that the standard homeowners policy exclusion leaves uninsured.

    The earthquake insurance market for homeowners in moderate-risk areas outside California has become more accessible through private insurers who offer earthquake endorsements to standard homeowners policies — often at premiums meaningfully below the California Earthquake Authority rates that apply to high-risk West Coast properties. For homeowners in the moderate-risk regions, the premium for earthquake coverage reflects the lower probability of a major event relative to California — making the coverage more cost-effective relative to the protection it provides than the California rates that dominate most earthquake insurance cost discussions.


    The Liability Gap That Threatens Households With Significant Assets

    The standard liability coverage available through auto and homeowners policies — typically $100,000 to $300,000 per occurrence — is inadequate for the worst realistic liability scenario for most households with significant assets. The gap between standard policy limits and the realistic worst-case judgment that a serious accident or injury could produce is the liability exposure that personal umbrella insurance addresses — and the absence of umbrella coverage from most households’ insurance portfolios is the most common liability gap in American personal insurance.

    The realistic worst-case liability scenario for an auto policyholder — a serious accident causing permanent injury to multiple people — can produce a judgment that exceeds $300,000 standard liability limits by a factor of five or more. The judgment above the policy limit becomes the personal financial liability of the at-fault driver — payable from home equity, retirement savings, investment accounts, and future wages through garnishment. The assets that represent a lifetime of financial accumulation are exposed to a single catastrophic accident without umbrella coverage.

    The personal umbrella policy that closes this gap provides $1 million to $5 million in additional liability coverage above the underlying auto and homeowners limits — at annual premiums that typically range from $150 to $400 for the first $1 million in coverage. The premium-to-protection ratio that umbrella insurance provides is among the most favorable available in any insurance category — and the households that most need the protection are the ones with the most significant assets to protect, who can most easily afford the modest premium that umbrella coverage requires.


    The Business Activity Gap in Personal Homeowners Policies

    The home-based business activity exclusion that most standard homeowners policies contain creates a coverage gap for the growing population of Americans who conduct business activity from their homes — a gap that extends from personal property coverage for business equipment to liability coverage for business-related injuries and professional liability for business-related errors.

    The specific coverage limitations that apply to home-based business activity under standard homeowners policies include sublimits on business personal property — typically $2,500 for on-premises business property — that are inadequate for businesses with significant equipment or inventory. The liability exclusion for business activities removes coverage for injuries occurring in the context of business operations — a client who visits the home office and is injured, a product sample that causes harm to a prospective customer, a business meeting that produces a liability claim. The professional liability exclusion removes coverage for errors and omissions that produce financial harm to business clients.

    The home business endorsement that most major homeowners insurers offer addresses these gaps by extending the homeowners policy to include business property at higher limits and business liability coverage for home-based business activities. For businesses beyond the home office scale — businesses with significant equipment, inventory, or client-facing operations — a standalone business owner’s policy provides the comprehensive business coverage that the homeowners endorsement doesn’t fully replicate.


    The Disability Income Gap That Most Workers Don’t Recognize Until It’s Too Late

    The disability income gap — the absence of adequate income replacement coverage for the working-age population’s most significant income risk — is the most financially consequential coverage gap that doesn’t involve property or liability. The probability that a working-age American will experience a disability lasting ninety days or more at some point during their working career significantly exceeds the probability of dying during that same period — yet life insurance ownership in the United States far exceeds disability income insurance ownership among the same population.

    The employer-sponsored short-term disability coverage that most full-time employees receive addresses temporary disability through the initial recovery period — typically replacing a portion of income for thirteen to twenty-six weeks. The employer-sponsored long-term disability coverage that some employers provide addresses extended disability — but the coverage amount, the definition of disability, and the tax treatment of the benefit vary enough across employer plans to make most employer long-term disability coverage inadequate as a standalone income protection strategy.

    The individual long-term disability policy that fills the gap — providing own-occupation disability coverage that replaces income when the specific occupation the insured was performing becomes impossible due to disability — is the coverage that most working professionals should have and most don’t. The premium for individual long-term disability coverage varies significantly by occupation, benefit amount, and the specific policy provisions that determine when and how the benefit applies — but the coverage that most professionals actually need is consistently more expensive and harder to obtain than the combination of employer disability benefits and Social Security disability that most workers assume will be adequate.


    The Rental Property Gap That Landlords Discover at Claim Time

    The landlord who rents a property and covers it under the standard homeowners policy that was in place before the property became a rental faces a coverage gap that most don’t discover until a claim reveals it. Standard homeowners policies are designed for owner-occupied properties — the coverage terms, pricing, and underwriting assumptions all reflect the owner’s ongoing presence in and management of the property. When the property becomes a rental, the coverage needs change in ways that the standard homeowners policy doesn’t automatically address.

    The specific coverage gaps that emerge when a property transitions from owner-occupied to rental include the loss of rental income coverage — the income the landlord loses when a covered property loss makes the property uninhabitable and the tenant stops paying rent. Landlord liability coverage for tenant-related injuries — which has different characteristics than the liability coverage for owner-occupied properties — may be handled differently under a standard homeowners policy than under a landlord policy designed for rental properties. The coverage for tenant-caused damage — losses that result from tenant negligence or intentional acts — is addressed more completely in dedicated landlord policies than in standard homeowners policies adapted for rental use.

    The landlord policy — also called a dwelling fire policy or rental property insurance — is the coverage designed specifically for rental properties and that addresses the specific gaps that standard homeowners policies create when applied to non-owner-occupied properties. The premium for a landlord policy is typically modestly above the homeowners premium for the same property — a difference that is justified by the coverage improvements that address the rental-specific gaps.


    The Cyber Liability Gap That Affects Small Businesses Disproportionately

    The cyber liability gap — the absence of insurance coverage for the financial consequences of data breaches, ransomware attacks, and other cyber incidents — affects small businesses more severely than large ones despite the common perception that cyber risk is primarily an enterprise concern. Small businesses are frequently targeted specifically because their cybersecurity infrastructure is less robust than large enterprises — and the financial consequences of a cyber incident are proportionally more severe for small businesses that lack the resources to absorb significant remediation, notification, and liability costs without insurance.

    The standard commercial general liability policy provides minimal cyber coverage — addressing specific narrow scenarios where cyber incidents produce third-party bodily injury or property damage but not the first-party costs of the breach itself or the third-party financial harm claims that arise from data breaches. The cyber liability gap in the standard CGL policy is the exposure that standalone cyber insurance addresses — providing first-party coverage for breach notification costs, data recovery expenses, business interruption from system downtime, and ransomware payment consideration alongside third-party coverage for the liability claims that affected customers and partners may bring.

    The cost of cyber insurance for small businesses has become more accessible as the market has matured — basic cyber liability coverage for a small professional services business might cost $500 to $1,500 per year for $1 million in coverage, a premium that is modest relative to the average cost of a small business data breach that independent research consistently estimates in the $50,000 to $200,000 range for businesses with modest data holdings.


    The Umbrella Policy Gap in Business Insurance

    The personal umbrella policy that most households should carry has a direct commercial equivalent — the commercial umbrella or commercial excess liability policy that extends the liability limits of the underlying business policies above the per-occurrence and aggregate limits of the primary coverages. Most small businesses carry general liability at standard $1 million per occurrence limits and professional liability at similar levels — and most small businesses don’t carry the commercial umbrella that would extend those limits for the catastrophic claims that standard limits don’t adequately address.

    The gap between standard business liability limits and the realistic worst-case business liability scenario varies by business type — but for businesses with significant client relationships, physical operations, or professional services where errors could produce large financial harm, the standard limits may represent a fraction of the realistic worst-case judgment. The commercial umbrella that fills this gap typically provides $1 million to $5 million in additional liability capacity above the underlying business policy limits — at premiums that reflect the low probability of claims reaching those excess layers.


    Closing the Gaps Before They Matter

    The coverage gaps described in this guide are not obscure risks that require unusual circumstances to produce financial harm — they’re standard structural gaps in common insurance arrangements that produce uninsured losses regularly enough to appear consistently in claims data, insurance litigation, and financial advisor conversations about preventable financial setbacks.

    The audit that identifies which of these gaps exist in a specific household’s or business’s coverage portfolio takes one to two hours and produces the specific coverage improvements that close the gaps before a loss reveals them. The coverage improvements that close the most significant gaps — flood insurance for unprotected homeowners, umbrella coverage for households with significant assets, disability income insurance for working professionals, and cyber liability for small businesses — are accessible and afford reasonable premiums relative to the financial exposure they address.

    The gap that is identified and closed before a loss is a problem solved. The gap that is discovered at claim time is a financial crisis that the premium savings from not closing it never compensated for. The hour spent identifying and closing coverage gaps before they matter is the most valuable insurance hour most households and businesses ever invest.


    The coverage gaps in this guide complete the insurance education that CoverageMastery.com is built to provide — from understanding what insurance is and how it works, through every major coverage category, to the strategy and savings approaches that produce the most efficient and most comprehensive coverage portfolio. If one guide in this series helped you identify a gap, make a better coverage decision, or save money on a policy you were overpaying for, the most useful next step is sharing it with someone facing the same decision — because the insurance knowledge that prevents a financial crisis is most valuable before the crisis rather than after it.

  • How to File Any Insurance Claim the Right Way — The Steps Most People Skip That Cost Them Money

    How to File Any Insurance Claim the Right Way — The Steps Most People Skip That Cost Them Money

    Filing an insurance claim is the moment the entire insurance relationship is tested — and most policyholders enter that moment less prepared than they should be for a process that directly determines how much of their covered loss is actually recovered. The premium payments made for years create a reasonable expectation that a covered loss will be fully and fairly compensated. The claims process that follows sometimes delivers that outcome automatically and sometimes requires the policyholder to navigate a process with specific steps, documentation requirements, and decision points where the uninformed choice produces a smaller recovery than the informed one.

    The steps that most people skip are not obscure procedural technicalities — they’re the straightforward actions that produce better claim outcomes consistently across every insurance category. The policyholder who takes those steps receives a more complete recovery. The policyholder who skips them accepts whatever the insurer’s initial process produces — which is sometimes the full fair recovery and sometimes significantly less.


    Step One: Understand What You’re Covered For Before Filing

    The most consequential pre-claim action is confirming that the loss is actually covered before initiating the claims process — because filing a claim for a non-covered loss creates a claims record without producing a recovery, and the claims record affects future premiums regardless of whether the claim resulted in a payment.

    The policy review that confirms coverage should focus on the specific cause of the loss — the peril that produced the damage — and whether that peril is covered or excluded under the policy. Water damage from a burst pipe is covered under most homeowners policies. Water damage from flooding is excluded under the same policies. The distinction between the two scenarios produces dramatically different claim outcomes, and a homeowner who files a claim for flood damage on a standard homeowners policy creates a claims record without recovering the loss.

    The deductible review that accompanies the coverage confirmation identifies the specific deductible that applies to the loss and the net recovery after deductible — which is the specific number that determines whether filing produces a financial benefit or creates a claims record without meaningful recovery. A loss that produces a net recovery modestly above the deductible — a $1,500 covered loss with a $1,000 deductible producing a $500 recovery — deserves the financial analysis that weighs the $500 recovery against the multi-year premium surcharge that filing the claim may trigger.


    Step Two: Document Everything Before Any Cleanup or Repair

    The documentation that supports a claim is most complete and most credible when it’s captured before the evidence is altered — before cleanup removes debris, before emergency repairs change the damage profile, before the specific pattern of damage is obscured by the restoration process. Most policyholders who skip this step do so from the understandable impulse to begin addressing the damage rather than photographing it — and the documentation gap that results produces settlements that reflect the adjuster’s reconstruction of the pre-cleanup damage rather than the evidence that the documentation would have established directly.

    The documentation standard that produces the most complete evidentiary record combines video and photography with written inventory. The video walkthrough — a narrated tour of the damaged area that captures the full scope of damage in context — establishes the overall picture that individual photographs don’t produce as clearly. The photographs capture the specific damage details — close-up shots of each damaged item or structural element alongside wide shots that show the relationship between damaged areas. The written inventory lists each damaged item with its description, approximate age, and estimated replacement cost — the specific record that supports the personal property claim component rather than requiring the adjuster’s estimate of what was present and what it was worth.

    The timing of this documentation is critical — the first hours after a loss, before any restoration activity, produce documentation that no subsequent effort can replicate. Building the documentation habit of photographing important assets before a loss — a room-by-room video of the home’s contents stored in cloud storage, a photographic inventory of business equipment stored offsite — provides the pre-loss reference that makes the documentation of post-loss damage far more compelling than the post-loss documentation alone.


    Step Three: Report the Claim Promptly Within the Policy’s Required Period

    Every insurance policy includes a timely reporting requirement — the obligation to report a covered loss to the insurer within a specified period that varies by policy and loss type. Late reporting that violates the timely reporting requirement gives the insurer grounds to deny coverage — not because the loss wasn’t covered but because the delay in reporting prejudiced the insurer’s ability to investigate the claim while the evidence was fresh.

    The timely reporting requirement is most significant for property claims where evidence deteriorates quickly — a water damage claim that is reported three weeks after the initial event may have produced mold growth that complicates the causation analysis and provides grounds for limiting the mold remediation coverage. The liability claim that is reported after the injured party has retained an attorney and initiated litigation is a claim that the insurer has lost the opportunity to resolve at an earlier stage when resolution was potentially less expensive.

    The reporting call that satisfies the timely reporting requirement is distinct from the full claim submission — calling the insurer to report the loss and receive a claim number preserves the reporting timeline even before the documentation is fully assembled and before the full scope of damage is assessed. The full claim submission that follows the initial report can incorporate the complete documentation and the damage assessment that takes more time to compile — the critical step is the initial report that starts the claims process within the required period.


    Step Four: Understand the Adjuster’s Role and Maintain Your Own Assessment

    The insurance adjuster who handles the claim performs the investigation, documents the damage, determines coverage, and produces the scope of loss and cost estimate that forms the basis for the settlement offer. Understanding the adjuster’s role — and the limitations of any single inspection in accurately capturing a complex loss — prevents the mistake of treating the adjuster’s initial estimate as the definitive final word on the claim value.

    The adjuster’s estimate reflects the inspection conducted on a specific day, the pricing database the adjuster’s software uses, and the coverage interpretation the adjuster applies to ambiguous situations. Each of these variables can produce an estimate that accurately reflects the loss or that understates it in ways that are correctable through additional documentation, independent contractor estimates, or coverage interpretation discussions.

    The policyholder’s parallel documentation — photographs, inventory, receipts, and independent contractor estimates — provides the reference for evaluating the adjuster’s estimate rather than accepting it without comparison. A line-by-line review of the adjuster’s estimate against the independently documented damage identifies the specific discrepancies — items documented but not in the estimate, repair methods that are less complete than the damage requires, materials specified at lower quality than the original — that form the basis for a specific and factual response rather than a general objection that the estimate is too low.


    Step Five: Get an Independent Contractor Estimate for Property Claims

    The independent contractor estimate is the most effective single step for property damage claims where the adjuster’s estimate appears to understate the repair or replacement cost — and it’s the step that most policyholders skip because it requires additional effort during an already stressful period.

    The independent estimate from a licensed contractor who specializes in the type of damage being repaired produces a market-rate repair cost that can be compared against the adjuster’s estimate line by line — identifying where the gap comes from and providing specific documentation that the insurer must address rather than a general assertion that the estimate is inadequate. An adjuster’s estimate that is $15,000 below a licensed contractor’s estimate for equivalent repairs creates a specific factual dispute that the insurer’s claims process must engage with — a much stronger position than the policyholder’s unsubstantiated assertion that the recovery should be higher.

    The contractor who produces the independent estimate should be asked specifically to address any items in the adjuster’s estimate where the method or the material specification is below what the damage requires — because these line-item discrepancies, documented by a professional whose business is the type of repair being estimated, are the most compelling evidence for a coverage dispute.


    Step Six: Negotiate the Settlement Before Accepting It

    The insurer’s initial settlement offer — whether presented as a check, a direct payment to a repair facility, or a formal settlement letter — is not necessarily the final and complete settlement of the claim. For every coverage type where the claim value involves estimation and judgment, the initial offer represents the insurer’s assessment of the appropriate settlement that the policyholder has the right to evaluate, challenge with specific evidence, and negotiate toward a more complete recovery.

    The negotiation that produces the best outcomes is specific and factual rather than emotional and general. Presenting the specific discrepancies between the insurer’s estimate and the independent contractor’s estimate — organized by line item with the specific justification for each difference — creates a structured negotiation agenda that the adjuster can respond to specifically rather than rejecting generally. Each specific discrepancy that is resolved in the policyholder’s favor produces a direct recovery improvement that the general objection approach doesn’t achieve as reliably.

    The negotiation timeline should begin before the initial settlement check is cashed — because cashing a settlement check that is presented as a full and final settlement of the claim may legally preclude challenging the settlement amount after cashing. Reviewing any settlement offer for language that characterizes it as full and final before cashing is the step that preserves the right to continue the negotiation if the initial offer is inadequate.


    Step Seven: Know When to Invoke the Formal Dispute Resolution Process

    When negotiation with the adjuster reaches an impasse — when the insurer and the policyholder cannot agree on the claim value through the standard negotiation process — most insurance policies provide formal dispute resolution mechanisms that produce a binding resolution without requiring litigation.

    The appraisal process available in most property insurance policies is the most accessible formal dispute mechanism — each party selects an independent appraiser, the two appraisers select a neutral umpire, and an agreement between any two of the three parties produces a binding determination of the disputed claim value. The appraisal process resolves valuation disputes specifically — how much the covered damage is worth — rather than coverage disputes about whether the damage is covered. Invoking the appraisal process requires following the specific procedural steps in the policy and making the demand in writing before accepting any partial payment that might be characterized as a full settlement.

    The insurance department complaint is the formal channel for coverage disputes — situations where the insurer is denying coverage for a loss that the policy appears to cover — rather than valuation disputes where the insurer and policyholder agree the loss is covered but disagree on its value. Filing a formal complaint with the state insurance department creates a regulatory record that the insurer must respond to and that sometimes produces coverage reconsideration without litigation.


    Step Eight: Understand the Premium Impact Before the Claim Becomes Final

    The financial analysis that should accompany every claim is the comparison of the claim recovery against the expected premium impact — the surcharge that at-fault claims trigger for three to five years following the filing. For small and medium claims where the recovery and the surcharge impact are in the same order of magnitude, the financial analysis frequently reveals that paying the loss out of pocket produces a better total financial outcome than filing the claim and absorbing the multi-year surcharge.

    The specific calculation that produces the correct answer compares the net claim recovery — the insurer’s payment after the deductible — against the expected annual surcharge multiplied by the surcharge duration. A $600 net claim recovery that triggers a $250 annual surcharge for three years produces a net financial loss of $150 from filing the claim compared to paying out of pocket — a result that the claim filing decision should have accounted for before the claim was filed.

    The claim filing decision analysis is only available before the claim is filed — the surcharge that follows a filed claim is unavoidable once the claim enters the insurer’s records. Building the habit of performing this analysis before filing rather than after produces consistently better financial outcomes for small and medium claims across every insurance category.


    The Documentation Habit That Makes Every Future Claim Better

    The single most impactful preparation for any future insurance claim is the pre-loss documentation habit — the ongoing practice of maintaining photographic evidence, purchase records, and inventory documentation for significant assets that creates the evidentiary foundation that makes any future claim easier to document, easier to substantiate, and more likely to produce a complete recovery.

    The home inventory stored in cloud storage — a room-by-room video of the home’s contents supplemented by a written record of significant items with their purchase prices and dates — is the most valuable single piece of claims documentation that most policyholders have never created. The inventory that takes two hours to create initially and thirty minutes per year to update produces the complete personal property claim documentation that memory-based reconstruction after a loss consistently underproduces.

    The business asset register that documents business equipment, its purchase date, its replacement cost, and its serial number provides the same foundation for business insurance claims — replacing the guesswork and memory reconstruction that produces incomplete business property claims with a documented record that supports a complete claim submission from the first interaction with the adjuster.


    Filing claims correctly is the final piece of getting full value from the coverage you’ve paid for — and knowing which coverage gaps most Americans carry without realizing it is the complement that ensures the coverage you have addresses the risks that matter most. Our guide on the insurance coverage gaps most Americans don’t know they have until it’s too late covers the specific coverage situations where the policies most people carry leave significant financial exposure unaddressed — so you can identify and close those gaps before a claim makes them financially consequential.


    Recently filed an insurance claim and found that the initial settlement offer was significantly below what the independent contractor estimated for the same repairs — or navigated a formal appraisal or insurance department complaint process to resolve a disputed claim? Leave a comment with the coverage type, the specific discrepancy, and how it resolved. Real claims experiences are the most useful information available for policyholders facing the same process.

  • How Much Insurance Do You Actually Need — And How to Stop Overpaying for Coverage You Don’t

    How Much Insurance Do You Actually Need — And How to Stop Overpaying for Coverage You Don’t

    The question of how much insurance is enough is the one that the insurance industry has the least financial incentive to answer honestly — because the answer that maximizes insurer revenue is always more coverage, and the answer that maximizes policyholder financial welfare is sometimes less coverage than is being sold. The gap between those two answers is where overpaying for insurance happens most consistently — not through deliberate deception but through the natural alignment of sales incentives with higher coverage amounts and the natural tendency of buyers to equate more coverage with more protection regardless of whether the additional coverage addresses a genuine financial exposure.

    This guide answers the coverage amount question for every major insurance category with the specificity that produces accurate coverage targets rather than comfortable-feeling round numbers — and identifies the specific patterns of overpayment that most households and businesses are carrying without knowing it.


    The Framework That Applies to Every Coverage Amount Decision

    The coverage amount framework that produces accurate targets across every insurance category rests on a single principle — the coverage amount should reflect the financial loss that would be catastrophic without insurance, sized to the realistic worst-case outcome rather than the average outcome or the maximum conceivable outcome.

    The average outcome framework produces underinsurance — because the average claim is smaller than the worst realistic claim, and sizing coverage to the average leaves the worst realistic outcome partially or entirely uninsured. The maximum conceivable outcome framework produces overinsurance — because the maximum conceivable outcome includes scenarios so unlikely that paying premiums to insure against them produces a worse expected financial outcome than accepting the small probability of the extreme scenario. The realistic worst-case framework produces appropriate coverage — the amount that eliminates the financially catastrophic scenarios while declining to insure the extremely unlikely extreme scenarios that premium spending can’t rationally address.

    The realistic worst-case definition requires honest assessment rather than either comforting minimization or anxiety-driven exaggeration — and that honest assessment is the most important and most frequently avoided step in any coverage amount decision.


    How Much Homeowners Insurance You Actually Need

    The homeowners insurance coverage amount question has a specific and calculable answer — the replacement cost of the home — that most policyholders approximate rather than calculate precisely, and the approximation error that accumulates over years of auto-renewal without recalculation produces the underinsurance gap that makes major homeowners claims financially devastating rather than fully recovered.

    The dwelling coverage limit should equal the replacement cost — what it would cost to rebuild the home from the foundation up using current materials, current labor rates, and current construction methods in the specific geographic market. The replacement cost is not the market value, not the purchase price, and not the assessed value — it’s the construction cost, which is determined by square footage, construction quality, architectural features, and local labor and material markets.

    The personal property coverage limit should equal the replacement cost of the household’s contents — the total cost to replace all furniture, clothing, electronics, appliances, and other personal property with new equivalents at current retail prices. The home inventory that produces this number takes two to three hours to complete for a typical household and produces a figure that consistently surprises most people — because the replacement cost of accumulated belongings is significantly higher than the intuitive estimate that most people apply without the inventory.

    The liability limit that the homeowners policy provides should be evaluated in the context of the total liability protection available across all policies — the homeowners liability, any umbrella or excess liability policy, and any other liability coverage. The realistic worst-case liability scenario for a homeowner — a serious injury to a guest, a dog bite that produces significant damages, a contractor injury that the homeowners policy is asked to address — should be fully covered by the combined liability limits across all applicable policies. For most households, the standard $100,000 homeowners liability limit is inadequate for the realistic worst-case scenario, and a personal umbrella policy that extends coverage to $1 million or more is the cost-effective solution.


    How Much Auto Insurance You Actually Need

    The auto insurance coverage amount decision has two distinct components — the liability coverage that protects others from harm the driver causes, and the physical damage coverage that protects the vehicle itself — and the appropriate amount differs significantly between the two.

    The liability coverage — bodily injury and property damage — should reflect the assets worth protecting rather than the legal minimum required for registration and operation. State minimum liability limits are almost universally inadequate for the realistic worst-case accident scenario — a serious multi-vehicle accident with significant injuries can produce damages that exceed state minimum limits by factors of ten or more. The realistic worst-case scenario for auto liability is the accident that produces significant injuries to multiple people — and the liability limit that addresses that scenario reflects the total potential judgment rather than the most common claim outcome.

    For households with significant assets — home equity, retirement savings, investment accounts — liability limits of $250,000 per person and $500,000 per accident are a more appropriate baseline than state minimums, and a personal umbrella policy that extends coverage to $1 million or more above the auto liability limits provides the most cost-effective additional protection for the assets above the auto policy limits.

    The physical damage coverage — collision and comprehensive — should reflect the vehicle’s current value rather than the vehicle’s original value. As vehicles depreciate, the maximum potential benefit from physical damage coverage declines while the premium doesn’t decline proportionally — which produces a point at which the annual premium for collision and comprehensive exceeds the financial benefit those coverages provide. The rule of thumb that suggests dropping collision and comprehensive when the vehicle’s actual cash value minus the deductible is less than ten times the annual premium for those coverages provides a practical threshold for the physical damage coverage decision as the vehicle ages.


    How Much Life Insurance You Actually Need

    The life insurance coverage amount decision is the most extensively documented in this series — the DIME method and the needs analysis approach both produce specific coverage targets that reflect the actual financial dependency rather than a comfortable round number. The summary for the coverage audit context covers the key variables without repeating the full calculation detail from the dedicated guide.

    The appropriate life insurance coverage amount reflects four components — the debt beyond the mortgage that the death benefit would retire, the income that would be replaced over the period the dependents need it, the mortgage balance that would be paid off, and the education funding that would be completed. The sum of these four components, adjusted for existing assets and existing life insurance that would contribute to covering the same needs, produces the net coverage gap that additional life insurance should address.

    The overpayment pattern that most commonly occurs in life insurance is maintaining coverage at levels that were appropriate at an earlier life stage without adjusting as the components of the coverage need change. A family whose mortgage has been paid down by $200,000, whose children have completed college, and whose retirement savings have grown to $800,000 has a genuinely different life insurance need than the same family fifteen years earlier when the mortgage was at its peak, the children were young, and the retirement savings were minimal. The coverage that was appropriate fifteen years ago is likely significantly above the current need — and the annual premium for the excess coverage is a genuine overpayment.


    How Much Health Insurance You Actually Need

    The health insurance coverage amount decision is different from every other insurance coverage amount decision — because health insurance doesn’t provide a lump-sum benefit that can be sized to a specific financial exposure but rather a cost-sharing structure that determines how medical expenses are divided between the insurer and the insured.

    The appropriate health insurance plan type and coverage structure reflects the realistic medical utilization anticipated for the coming year rather than an abstract coverage level preference. A consistently healthy person who uses minimal healthcare beyond preventive care has a different optimal coverage structure than a person with chronic conditions, regular specialist care, and prescription medication needs — and the plan selection that produces the best financial outcome reflects that difference.

    The most significant health insurance overpayment pattern is selecting a Gold or Platinum plan for coverage reasons that a Silver or Bronze plan with adequate emergency savings would address more cost-effectively — paying a higher premium for lower cost-sharing without accurately modeling whether the total cost at realistic utilization levels is actually lower for the premium plan than for the lower-premium alternative. For consistently healthy people who rarely exceed the Bronze plan’s deductible, the Gold plan represents a significant premium overpayment relative to the cost-sharing benefit received.

    The most significant health insurance underpayment pattern — accepting inadequate coverage to minimize premiums — is less a coverage amount problem than a plan selection problem. The ACA’s out-of-pocket maximum provides a coverage floor that prevents the catastrophic out-of-pocket exposure that pre-ACA coverage sometimes produced — but the plans that provide the lowest premiums also provide the least accessible coverage before the deductible, which produces the highest total costs for people with significant healthcare needs who selected the lowest-premium option without calculating total cost at realistic utilization.


    How Much Business Insurance You Actually Need

    The business insurance coverage amount framework applies the same realistic worst-case analysis that personal insurance uses — but with the additional dimension of the legal requirements that establish minimum coverage levels regardless of the business owner’s risk tolerance.

    The general liability coverage amount should reflect the realistic worst-case liability claim for the specific business type — the injury severity, property damage magnitude, or financial harm that the most serious plausible claim against the business would produce. A retail store’s worst realistic bodily injury claim is different from a contractor’s worst realistic claim — and the liability limit that adequately addresses one business type’s worst realistic scenario may be inadequate or excessive for another.

    The professional liability coverage amount should reflect the financial harm that the largest and most complex professional error the business could plausibly make would produce for the affected client — not the average engagement value but the largest engagement value multiplied by the realistic severity of a professional error affecting the full engagement. For a consultant whose largest engagements produce $500,000 in fees, the professional liability limit that addresses the realistic worst-case error scenario on that engagement is meaningfully different from the $100,000 limit that might be appropriate for a freelancer whose largest engagements produce $25,000 in fees.

    The workers compensation coverage amount is determined by state law rather than by the business’s risk assessment — the benefit levels are established by statute, and the insurance provides those statutory benefits regardless of the coverage amount the business selects. The workers compensation decision is less about coverage amount than about accurate classification and payroll reporting that produces a premium reflecting the actual exposure rather than an inflated estimate.


    The Overpayment Patterns Most Households and Businesses Are Carrying

    Bringing the coverage amount analysis across all categories together reveals the most common overpayment patterns — the specific coverage situations where premium spending exceeds the financial value of the protection being purchased.

    Collision and comprehensive coverage on depreciated vehicles is the most common personal auto overpayment — the coverage that continues past the point where the maximum net payout approaches the cumulative annual premium for the coverage. The household with three vehicles, one of which is fully depreciated and worth less than $4,000, is likely overpaying for physical damage coverage on that vehicle while the other two vehicles appropriately continue with full coverage.

    Excess life insurance above the current coverage need is the most common life insurance overpayment — the coverage that remains at levels calibrated to an earlier life stage with larger financial dependencies and fewer accumulated assets. The annual premium for coverage above the current need is a genuine overpayment that a policy review and adjustment would recover.

    Over-insured property at values above replacement cost occurs less commonly than underinsurance but represents a genuine overpayment when it does occur — particularly for properties whose market values have declined while coverage limits have remained at the purchase price levels. For businesses, insuring equipment at replacement cost when actual cash value coverage adequately addresses the financial exposure for specific equipment categories represents a premium overpayment that a coverage basis review would identify.


    What Adequate Coverage Actually Costs

    The accurate coverage amount framework produces coverage targets that, when priced competitively through the comparison process the previous guides describe, reveal what adequate insurance actually costs for a specific household or business situation — and the result is frequently different from either the expensive comprehensive coverage that selling incentives push toward or the inadequate minimum coverage that premium minimization produces.

    The household that carries accurate homeowners replacement cost coverage, appropriate auto liability limits with an umbrella policy, adequate life insurance based on current financial dependencies, and competitively priced health insurance pays for genuine protection against the financial risks that would be catastrophic without it — and pays nothing for coverage that addresses risks the household doesn’t face or that are sized to financial exposures the household doesn’t carry. That household’s insurance cost reflects efficiency rather than either the over-coverage of selling incentives or the under-coverage of premium minimization.


    Understanding how much coverage you need is the foundation for stopping overpayments — knowing how to file any insurance claim correctly when a covered loss does occur is the step that ensures the coverage you’re paying for actually delivers its full value. Our guide on how to file any insurance claim the right way — the steps most people skip that cost them money covers the claims process across every insurance category with enough specificity to maximize the recovery from any covered loss.


    Worked through the coverage amount framework for your own situation and found that you’re either significantly over or under insured in a specific category — or trying to apply the realistic worst-case framework to a specific coverage situation and not sure how to define the worst realistic scenario for your specific risk? Leave a comment with the coverage category and your situation. We’ll help you identify the appropriate coverage target and whether your current coverage reflects it accurately.

  • The Complete Insurance Audit: How to Review All Your Policies Once a Year and Save Money Every Time

    The Complete Insurance Audit: How to Review All Your Policies Once a Year and Save Money Every Time

    The annual insurance audit is the single most financially productive hour that most households and small businesses never spend — a structured review of every active insurance policy that catches coverage gaps before they produce uninsured claims, identifies redundant coverage that’s been paying premiums without providing practical value, and reveals pricing opportunities that accumulate unnoticed when policies renew automatically without comparison. The audit produces savings in both directions simultaneously — eliminating unnecessary spending on coverage that doesn’t apply to the current situation and preventing the more expensive outcome of discovering inadequate coverage at the moment a claim makes the inadequacy financially consequential.

    Most people review their insurance once — when they buy it — and then renew automatically for years without asking whether the coverage still reflects the situation it was purchased to address. Life changes, asset values change, risk profiles change, and insurance markets change — all independently of the renewal process that continues the previous year’s coverage at an updated price without asking whether the updated price reflects the most competitive option or whether the coverage still fits the current situation.


    What the Annual Insurance Audit Actually Involves

    The annual insurance audit is not a single action — it’s a structured process that applies four specific evaluations to every active policy in the household’s or business’s insurance portfolio. Understanding the four evaluations before beginning the audit produces a more complete review than approaching each policy without a consistent framework.

    The coverage adequacy evaluation confirms that the coverage limits on each policy still reflect the actual financial exposure they’re designed to protect — that the homeowners dwelling limit still reflects the current replacement cost, that the life insurance coverage still reflects the current income replacement and financial dependency needs, and that the business insurance limits still reflect the current revenue and property values. Coverage limits that were set accurately at policy inception become inadequate as asset values and financial exposures change — and the adequacy evaluation catches the drift before it creates an uninsured gap.

    The coverage applicability evaluation confirms that the coverage types on each policy still address genuine financial exposures rather than risks that no longer exist or that have been addressed through life changes. The rental car reimbursement coverage on a household that acquired a second vehicle, the child rider on a life insurance policy whose child has reached financial independence, and the earthquake endorsement on a property that has been relocated to a low-seismic-risk area all represent coverage that may no longer apply to the current situation — and eliminating inapplicable coverage produces premium savings without creating coverage gaps.

    The pricing competitiveness evaluation confirms that the premium for each policy reflects competitive market pricing rather than the renewal pricing that accumulates when policyholders accept automatic renewals without comparison. Insurance premiums are not set by a single market price — they vary by insurer based on underwriting philosophy, competitive strategy, and the specific risk factors each insurer weights most heavily. The pricing that was competitive at policy inception may no longer be competitive at renewal if market dynamics have shifted or if the insurer has repositioned its pricing for the current risk environment.

    The coverage gap evaluation identifies the financial exposures that are not addressed by any current policy — the risks that have emerged through life changes, asset acquisition, or business growth that create new financial exposure without corresponding coverage. A home-based business that has grown to generate significant revenue without business insurance, a valuable jewelry collection acquired since the last homeowners policy review without a scheduled endorsement, and a teenage driver added to the household without confirming the auto policy structure addresses the new driver correctly all represent coverage gaps that the annual audit identifies before a claim makes them financially consequential.


    The Audit Sequence That Produces the Most Complete Review

    The audit sequence that produces the most complete review processes each policy in a consistent order that builds on the previous evaluation rather than approaching each policy independently without the context that the portfolio-level view provides.

    Starting with the asset inventory — a current list of all significant assets including their current values — provides the reference point against which each property-related policy is evaluated for adequacy. The asset inventory for a household includes the home’s current replacement cost, the current market value of each vehicle, the replacement cost of significant personal property, and any high-value items that may require scheduled endorsements. The asset inventory for a business includes business equipment and its current replacement cost, inventory at current values, and any improvements to leased space that represent insurable business property.

    The liability exposure review follows the asset inventory — an assessment of the current liability exposure across personal and business activities that determines whether the liability limits on existing policies are adequate for the current exposure. The liability exposure that matters most for limit adequacy is not the average claim but the realistic worst-case claim — the injury severity scenario that could produce a judgment in the range that would exhaust the current liability limits and expose personal or business assets beyond the coverage.

    The income and financial dependency review applies to life and disability insurance — confirming that the coverage amount and the coverage type still reflect the current income, the current financial dependencies, and the current financial goals that the coverage is designed to protect. The income replacement need that was calculated at policy purchase changes as income changes, as dependents change status, as debts are paid off, and as asset accumulation reduces the gap between the financial security the insurance provides and the financial security the existing assets would produce without the insurance.


    The Homeowners Policy Audit

    The homeowners policy audit applies the four evaluations to the coverage that protects the largest asset most households own — and the coverage adequacy evaluation is the most consequential component because the underinsurance gap that develops as replacement costs increase without corresponding coverage limit adjustments produces the most financially devastating claim outcomes in the personal insurance portfolio.

    The dwelling coverage limit is the first and most important number to verify in the homeowners audit. Comparing the current dwelling limit against the insurer’s replacement cost estimator — updated with current construction costs rather than the costs at the time the limit was originally set — identifies any gap that has developed since the last accurate replacement cost calculation. Construction costs have increased significantly in recent years, and the inflation guard adjustment that most policies apply annually has frequently fallen below the actual rate of construction cost increase — producing a coverage gap that grows silently with each year that the adjustment lags the actual cost increase.

    The personal property coverage basis — replacement cost versus actual cash value — and the personal property limit relative to the current value of the household’s contents are the second and third verification points. The home inventory that documents the current replacement cost of significant items provides the reference for confirming that the personal property limit is adequate and that the coverage basis produces claims payments that actually replace damaged items rather than paying the depreciated value that leaves a replacement cost gap.

    The sublimits that apply to high-value item categories — jewelry, art, electronics, collectibles, musical instruments — require verification against the current value of items in each category. Items whose value has grown through appreciation or acquisition may exceed the sublimit that the policy applies, creating an uninsured portion that a scheduled endorsement would address. The audit identifies these gaps before a theft or loss reveals them at the worst possible moment.


    The Auto Policy Audit

    The auto policy audit applies the four evaluations to the coverage that most households pay for most frequently — and the pricing competitiveness evaluation is the most impactful component because auto insurance markets are competitive enough that the most favorable pricing for a specific driver profile can shift significantly between insurers from year to year.

    The liability limits verification confirms that the current limits reflect the assets worth protecting rather than the minimums required for legal compliance. A household whose net worth has grown significantly since the policy was last reviewed may be carrying liability limits that were adequate for the earlier financial situation and inadequate for the current one — a gap that an umbrella policy addition or a liability limit increase would address.

    The coverage applicability evaluation for auto insurance includes reviewing whether collision and comprehensive coverage on each vehicle still reflects the vehicle’s current value. Vehicles that have depreciated to values close to or below the annual premium for collision and comprehensive coverage plus the deductible represent coverage candidates for elimination — where self-insuring the remaining vehicle value through emergency savings produces better expected financial outcomes than continuing the coverage.

    The discount verification confirms that all available discounts are applied to the current policy — including good driver status, safety feature discounts, telematics program eligibility, and any affinity or professional organization discounts that may have become available since the policy was last reviewed. The systematic discount audit that the previous guide covers in detail produces the most complete discount capture when applied specifically during the annual audit rather than as an isolated exercise.


    The Life Insurance Policy Audit

    The life insurance audit applies the four evaluations to the coverage that most directly affects the financial security of the people who depend on the insured’s continued income — and the coverage adequacy evaluation is the most consequential component because the income replacement need changes significantly as life circumstances evolve.

    The coverage amount verification compares the current policy benefit against the current needs analysis calculation — the DIME or income replacement calculation that produces the appropriate coverage target given the current income, current debts, current mortgage balance, and current education funding needs. Coverage that was adequate when purchased may be over or under the current need — a mortgage that has been paid down reduces the mortgage component of the needs calculation, while a new child increases the income replacement and education components.

    The policy type applicability evaluation reviews whether the term or permanent structure of the current policy continues to match the coverage philosophy — whether a term policy’s remaining coverage period still aligns with the period during which financial dependencies will exist, or whether a permanent policy continues to serve the specific estate planning, business planning, or final expense purpose for which it was purchased. Term policies that were purchased for a specific period of need should be evaluated against the remaining period of that need — a twenty-year term policy purchased fifteen years ago may have only five remaining years of coverage for a need that extends further.


    The Business Insurance Policy Audit

    The business insurance audit applies the four evaluations to the coverage portfolio that protects the business’s financial viability — and the coverage gap evaluation is the most consequential component because business growth and operational changes frequently create new coverage needs that the original policy structure didn’t anticipate.

    The general liability limits verification confirms that the current occurrence and aggregate limits still reflect the business’s current revenue, client base, and operations. A business that has doubled its revenue since the last policy review has likely doubled its liability exposure — and the limits that were adequate at the lower revenue level may be inadequate at the current level.

    The coverage type applicability evaluation reviews whether the current policy types still address the primary liability exposures the business faces — whether the professional liability coverage reflects the current scope of professional services, whether the commercial property coverage reflects the current value of business property, and whether any new business activities have created coverage needs that the existing policies don’t address.


    The Audit Documentation That Makes Future Reviews More Efficient

    The documentation produced during the annual audit creates the reference that makes future audits more efficient and the record that supports insurance decisions in the intervening months between audits.

    The coverage summary — a single document listing every active policy, its coverage limits, its deductible structure, its renewal date, and the insurer — provides the portfolio-level view that individual policy reviews don’t produce. The coverage summary allows identifying redundancies across policies, gaps between policies, and the renewal dates that trigger future comparison opportunities.

    The quote comparison record from the pricing competitiveness evaluation preserves the market reference that supports the renewal decision and the switching decision if the comparison reveals a more competitive alternative. The record of what was compared and what the comparison produced is the documentation that prevents repeating the full comparison in the following year when the insurer’s renewal increase triggers a competitive review.


    Making the Audit an Annual Habit

    The annual insurance audit that produces the most consistent savings and the most reliable coverage quality is the one that happens at the same time every year — a scheduled commitment rather than a reactive response to a renewal notice or a premium increase. The specific time that works best varies by household — some households time the audit to coincide with the homeowners renewal, others with the auto renewal, and others with the calendar year-end financial review that addresses all financial planning decisions simultaneously.

    The hour that the audit requires produces returns that compound across every year that it catches a coverage gap before a claim, a pricing opportunity before the renewal, or a redundancy that has been generating unnecessary premium spending. The compounding makes the annual habit more valuable than any single audit — and the habit that produces the most consistent savings is the one that becomes automatic rather than the one that depends on motivation renewed each year.


    The annual audit covers the insurance portfolio comprehensively — but knowing how much insurance you actually need across every category is the foundation that makes the adequacy evaluation in each audit most accurate. Our guide on how much insurance do you actually need — and how to stop overpaying for coverage you don’t covers the coverage amount framework for every major insurance category in one place, so the adequacy evaluation in the annual audit has a consistent methodology rather than a different approach for each coverage type.


    Completed an insurance audit and discovered either a significant coverage gap or a significant overpayment that had been accumulating unnoticed — or planning a first-time audit and not sure where to start given the number of active policies? Leave a comment with the policies you’re reviewing and the specific coverage type you’re most uncertain about. We’ll help you identify the most important evaluation to prioritize and the specific questions to ask for each coverage type.

  • How to Bundle Your Insurance Policies the Right Way — And When Bundling Actually Costs You More

    How to Bundle Your Insurance Policies the Right Way — And When Bundling Actually Costs You More

    Insurance bundling is the most consistently advertised premium reduction strategy in the industry — and it’s the strategy whose actual financial benefit is most inconsistently realized by the policyholders who pursue it. Every major insurer runs advertising that promotes multi-policy discounts, and the bundling conversation that follows is almost universally framed as a savings opportunity rather than as the more nuanced financial decision it actually is. The bundling discount is real and it produces genuine savings for a significant proportion of policyholders who pursue it. It also produces the appearance of savings while actually costing more than the unbundled alternative for a proportion that most bundling conversations don’t acknowledge.

    Understanding when bundling produces genuine savings, when it doesn’t, and how to evaluate the specific bundling opportunity in front of you rather than assuming the answer based on the discount percentage produces a bundling decision that reflects the actual financial outcome rather than the marketed one.


    What Insurance Bundling Actually Is and How the Discount Works

    Insurance bundling is the practice of purchasing multiple insurance policies from the same insurer in exchange for a multi-policy discount that reduces the premium on each bundled policy. The most common bundling combination is auto and homeowners insurance — the two personal lines policies that most households carry and that the major insurers have built their bundling marketing around. Other bundling combinations include auto and renters insurance, auto and life insurance, homeowners and umbrella insurance, and multiple business insurance policies with the same commercial insurer.

    The discount mechanism works differently at different insurers — some apply a flat percentage discount to each policy in the bundle, others reduce the base rate that applies to bundled policies before other factors are applied, and others provide a dollar credit that reduces the total combined premium by a fixed amount. The percentage discount that appears in the marketing — “save up to 25% by bundling” — reflects the maximum discount available under the most favorable circumstances rather than the typical discount that most bundling arrangements produce.

    The discount range that most policyholders actually receive from bundling falls between 5% and 20% on each policy — with the specific discount reflecting the insurer’s underwriting appetite for the bundled risk combination, the competitive position the insurer is trying to establish for bundled customers, and the base rates that apply to the specific policies before the discount is applied. The 25% discount that the advertising features is available for specific combinations at specific insurers but is not representative of the typical bundling outcome.


    When Bundling Produces Genuine Savings

    The bundling arrangement that produces genuine savings is one where the bundled insurer’s base rates — before the bundling discount — are competitive enough with the market that the discount closes the gap and produces a total bundled cost below what the best available unbundled alternatives would charge for equivalent coverage.

    The clearest bundling win occurs when the insurer where the primary policy — typically auto or homeowners — is already competitively placed also offers a competitive secondary policy, and the bundling discount reduces the combined cost below the cost of the primary policy at that insurer plus the best available alternative for the secondary policy at any other insurer. In this scenario, the policyholder gets the competitive primary policy, a competitive secondary policy from the same insurer, and an additional discount that reduces both below their standalone pricing — a genuine three-way win that bundling advertising accurately represents.

    State Farm is the insurer where bundling most consistently produces this outcome for the households whose risk profiles align with State Farm’s preferred underwriting — because State Farm’s auto and homeowners pricing is competitive for a significant portion of the mid-risk market, and the bundling discount it provides on the combined purchase is generous enough to produce a total combined cost that is difficult to beat through unbundled alternatives at any combination of competitors. For State Farm-aligned risk profiles, the bundling conversation genuinely produces savings rather than the appearance of savings.

    The bundling win also occurs when the convenience value of managing multiple policies through a single insurer, a single renewal date, and a single claims contact — a convenience that has real value in time and complexity — is worth a modest premium above the unbundled alternative. The policyholder who would pay $50 more per year for the bundled convenience because the complexity reduction is genuinely worth $50 is making a rational bundling decision even when the financial outcome is marginally unfavorable.


    When Bundling Costs More Than It Appears to Save

    The bundling arrangement that costs more than it appears to save occurs when the bundled insurer’s base rates are uncompetitive enough in one or both policy categories that the bundling discount doesn’t close the gap between the bundled premium and the best available unbundled alternative.

    The specific scenario that produces the most common bundling overpayment is the insurer that is competitive on auto insurance but uncompetitive on homeowners insurance — or vice versa — where the bundling discount reduces both policies but leaves the uncompetitive policy still priced above the market. A policyholder who gets a 15% auto bundling discount from an insurer whose auto base rate is competitive and a 15% homeowners bundling discount from the same insurer whose homeowners base rate is 35% above the market is paying net 20% above the market for homeowners insurance despite the bundling discount — more than the best available homeowners alternative would charge without any bundling benefit.

    The geographic market concentration that some insurers maintain — where they are genuinely competitive in specific regions and significantly uncompetitive in others — produces bundling outcomes that vary enough by location to make geographic verification essential rather than assuming that the bundling math works the same way in every market. An insurer that produces bundling savings for a policyholder in Texas may produce a bundling premium for a policyholder in California — because the base rates that apply in each market, and the competitive dynamics that determine how those base rates compare to alternatives, are genuinely different.


    The Math That Reveals Whether Bundling Saves or Costs

    The calculation that determines whether bundling produces genuine savings or the appearance of savings is straightforward to perform and takes approximately thirty minutes to complete — thirty minutes that most policyholders never invest because the bundling discount is presented as obviously beneficial without the comparison that would reveal whether it actually is.

    Step one is obtaining the bundled quote from the insurer offering the bundling discount — the total premium for both policies with the bundling discount applied. This is the number that bundling marketing presents as the savings destination.

    Step two is obtaining the best available standalone quote for each policy separately from the most competitive insurer in each category — the best auto quote from any insurer regardless of whether it’s the bundling insurer, and the best homeowners quote from any insurer regardless of whether it’s the bundling insurer. This step requires getting actual quotes rather than estimates — because the comparison that uses estimates produces an inaccurate result that overestimates or underestimates the unbundled alternative.

    Step three is adding the two standalone quotes to produce the total unbundled cost — the amount that would be paid if each policy were purchased from the most competitive carrier in each category without any bundling discount.

    Step four is comparing the bundled total from step one against the unbundled total from step three. If the bundled total is lower, bundling produces genuine savings and the bundling decision is financially sound. If the unbundled total is lower, the bundling discount doesn’t compensate for the base rate difference between the bundling insurer and the most competitive alternatives, and purchasing each policy from the most competitive carrier produces genuine savings rather than the appearance of them.

    The result of this calculation is specific enough to make the bundling decision confidently rather than based on the assumption that the advertised discount represents a genuine win without comparison.


    The Coverage Verification That Bundling Math Often Skips

    The bundling math that compares total costs produces a complete picture of the financial outcome only when the policies being compared are equivalent in coverage quality — and coverage quality differences between the bundled option and the unbundled alternative frequently explain a portion of the price difference that the comparison attributes to insurer efficiency.

    The coverage verification that should accompany the bundling math confirms that the bundled policy and the unbundled alternative provide equivalent coverage on the dimensions that matter most for the specific risk situation — the same dwelling coverage limit on replacement cost basis for homeowners, the same liability limits for auto, the same deductibles for each coverage component. Coverage differences that make the bundled option cheaper through reduced coverage rather than through pricing efficiency are not genuine savings — they’re coverage reductions that look like savings until a claim reveals the difference.

    The specific coverage dimensions worth verifying for the most common bundling combination — auto and homeowners — include the homeowners dwelling coverage basis (replacement cost vs actual cash value), the personal property coverage basis and any sublimits, the homeowners liability limit and whether an umbrella policy fills any gap, and the auto liability limits relative to the assets the coverage protects. Each of these dimensions can differ between the bundled option and the best unbundled alternative in ways that explain a price difference that appears to reflect insurer efficiency but actually reflects coverage reduction.


    The Business Insurance Bundling That Most Small Businesses Don’t Evaluate

    The bundling concept that applies to personal insurance lines applies equally to commercial insurance — and small businesses that purchase multiple coverage types from separate insurers may produce a bundled alternative through a business owner’s policy that provides better pricing than the sum of separately purchased coverages.

    The business owner’s policy is the commercial equivalent of the personal lines bundle — general liability and commercial property packaged together at a combined premium that is typically lower than the two coverages purchased separately from the same or different insurers. The BOP represents the most efficient commercial insurance structure for businesses that qualify — and evaluating the BOP alternative to separately purchased general liability and property coverage is the commercial bundling analysis that most small businesses never complete because the separate policy structure that was established at business formation was never revisited.

    The commercial bundling analysis that extends beyond the BOP includes the professional liability, workers compensation, and commercial auto coverages that some insurers bundle with the BOP through package policies — and the evaluation of whether the packaged alternative produces better coverage and pricing than the separately purchased alternatives follows the same math as the personal lines bundling analysis.


    The Annual Review That Keeps the Bundling Decision Current

    The bundling decision that was financially sound when made may not remain financially sound as the insurer’s pricing strategy changes, as competitors’ pricing changes, and as the household’s or business’s risk profile changes in ways that affect how competitively the bundling insurer is positioned for the current situation.

    The annual bundling review that confirms the bundled arrangement still produces genuine savings follows the same three steps as the initial evaluation — bundled quote at renewal, best available unbundled quotes for each coverage, comparison. If the bundled total remains below the unbundled alternative, the bundling decision remains sound. If the renewal premium increase has shifted the comparison in favor of unbundling, the annual review reveals the shift before it compounds for another policy year.

    The switching cost of unbundling — the administrative effort of establishing new policies with different carriers, potentially managing different renewal dates, and losing the bundling discount on the remaining bundled policies — represents a real friction that makes a small unbundled savings less compelling than the math alone suggests. The switching cost threshold — the minimum unbundled savings that justifies the switching effort — varies by policyholder but is typically in the range of $100 to $300 per year for personal lines policyholders who place moderate value on their time and low value on the simplicity of single-insurer management.


    Bundling correctly is one piece of the insurance cost optimization picture — understanding how to audit every policy annually to catch coverage gaps, redundancies, and pricing opportunities that individual policy reviews miss is the comprehensive approach that produces the most complete optimization. Our guide on the complete insurance audit — how to review all your policies once a year and save money every time covers the full audit process that makes the bundling evaluation one component of a systematic annual review rather than an isolated decision.


    Currently bundled with one insurer and wondering whether the combined premium is actually competitive — or considering bundling for the first time and trying to decide whether the discount from a specific insurer outweighs the competitive pricing available from separate carriers? Leave a comment with your current insurer, the policies you’re considering bundling, and your state. We’ll help you identify whether the bundling math is likely to work in your favor for the specific combination you’re evaluating.

  • How to Choose the Right Insurance Policy in 2026 — A Step-by-Step Guide That Saves You Money Before You Sign

    How to Choose the Right Insurance Policy in 2026 — A Step-by-Step Guide That Saves You Money Before You Sign

    The insurance policy selection process that most people follow — getting a quote, comparing the premium to what they’re currently paying, and accepting the lower number — produces coverage decisions that optimize for the one variable that matters least at claim time and ignores the variables that determine whether the insurance actually works when it’s needed. The premium is the cost of a promise. The policy is the promise. And the gap between what the premium implies about the promise and what the policy actually delivers is where the most expensive insurance surprises originate.

    This guide covers the step-by-step process that produces informed insurance purchase decisions — decisions that account for the coverage quality, not just the coverage cost, and that produce policies that deliver what the premium suggests rather than policies that look affordable until a claim reveals what they don’t cover.


    Step One: Define the Risk You’re Actually Trying to Cover

    The insurance purchase process that produces the best outcomes starts before any quote is requested — with a clear definition of the specific financial risk that the coverage is designed to address. Without that definition, the policy selection has no standard against which to evaluate whether the coverage is adequate, and the premium comparison has no context for understanding whether the lower-priced option produces equivalent protection or a coverage gap dressed as savings.

    The risk definition requires answering three specific questions honestly. First, what is the worst realistic financial outcome that could occur without this coverage — not the worst conceivable outcome but the worst outcome that has a meaningful probability of occurring for the specific situation? A homeowner in a flood-prone area defining the worst realistic outcome for their property acknowledges the flood risk that standard homeowners insurance excludes — and that definition immediately reveals a coverage need that the homeowners policy alone doesn’t address.

    Second, what is the financial impact of that worst realistic outcome on the household’s or business’s financial trajectory — is the impact financially catastrophic, significantly disruptive, or manageable? Catastrophic impacts justify premium spending to eliminate them. Manageable impacts may be more efficiently handled through emergency savings than through insurance premiums.

    Third, does the insurance product being evaluated actually address the worst realistic financial outcome that was identified in the first two questions — or does it address a related but different risk that leaves the worst realistic outcome uninsured? A business owner who defines the worst realistic outcome as a professional liability claim but purchases only general liability has answered the third question incorrectly — the purchased coverage doesn’t address the identified risk.


    Step Two: Research the Coverage Type Before Researching the Price

    The coverage type research that should precede any price comparison establishes what the coverage is actually supposed to do — the perils it covers, the perils it excludes, the limits structure that determines maximum payouts, and the conditions that affect when coverage applies. Without this research, the premium comparison is comparing products that may be fundamentally different in ways that the price doesn’t reveal.

    The coverage type research for each insurance category covers four specific areas. The covered perils — the events that trigger the insurance benefit — determine whether the coverage addresses the specific risk that was defined in step one. The excluded perils — the events that the policy explicitly doesn’t cover — reveal the gaps that separate the coverage from comprehensive protection. The limits structure — occurrence limits, aggregate limits, sublimits for specific categories — determines the maximum benefit available in different claim scenarios. The conditions and requirements — the policyholder obligations that must be met for coverage to apply — reveal the behavioral requirements that affect coverage availability at claim time.

    This research takes one to two hours for a coverage category being purchased for the first time and thirty minutes for a coverage renewal where the research from the previous purchase established the foundation. The time investment prevents the most expensive insurance purchase mistakes — the coverage decisions that produce the wrong product because the buyer didn’t understand what the product actually does.


    Step Three: Determine the Appropriate Coverage Amount Before Requesting Quotes

    The coverage amount decision — how much insurance to buy — should be made before requesting quotes rather than after receiving them, because quotes received before the coverage amount decision influence that decision in ways that produce underinsurance rather than accurate coverage.

    The coverage amount that is determined independently of the price tends to reflect the actual financial exposure — the realistic worst-case outcome identified in step one. The coverage amount that is determined after seeing prices tends to reflect the amount of coverage that feels affordable rather than the amount that addresses the actual financial exposure — which produces systematic underinsurance across every insurance category.

    The coverage amount determination methods vary by insurance type — replacement cost for property, income replacement for life insurance, realistic liability exposure for liability coverage — and each method is specific enough to apply to the actual situation rather than accepting a default or a percentage-of-income rule of thumb that may or may not reflect the actual need. Using the specific method for each coverage type produces a coverage target that the quote request can specify explicitly — which produces quotes for the appropriate coverage amount rather than the insurer’s default offering.


    Step Four: Gather Multiple Quotes for Identical Coverage

    The quote comparison that produces useful information compares identical coverage — the same limits, the same deductibles, the same endorsements, and the same coverage types — across multiple insurers. The quote comparison that produces misleading information compares different coverage at different prices and attributes the price difference to insurer efficiency when the actual cause is coverage differences.

    Obtaining quotes from at least three insurers for identical coverage — including at least one direct insurer, one agent-based insurer, and one comparison platform that produces quotes from multiple carriers — produces a comparison set wide enough to identify competitive pricing rather than accepting a single quote as the market rate.

    The specific coverage details that must be identical for the comparison to be valid include the coverage limits for each component — not just the primary limit but the sublimits for specific categories. A homeowners quote that specifies $300,000 in dwelling coverage, $150,000 in personal property at replacement cost, $100,000 in liability, and a $1,000 deductible is a complete specification that produces comparable quotes. A homeowners quote that specifies only the dwelling coverage amount leaves the personal property coverage basis, liability limit, and deductible to the insurer’s discretion — producing quotes that may differ significantly in ways that the premium comparison doesn’t reveal.


    Step Five: Review the Policy Language for the Three Most Important Provisions

    The step that separates informed insurance buyers from uninformed ones is reviewing the actual policy language — not the marketing summary, not the quote comparison page, but the specific policy provisions that determine what the coverage actually does. Three provisions warrant specific review for every policy before purchase.

    The exclusions section defines the coverage boundaries — the specific situations, events, and damage types that the policy explicitly doesn’t cover. Every exclusion in the policy represents a coverage gap that the premium doesn’t address, and knowing those gaps before purchase allows supplementing the coverage or adjusting the risk management approach rather than discovering the gap at claim time. The exclusions that most commonly produce expensive claim surprises are the ones that are specific to the coverage type — the flood exclusion in homeowners policies, the professional services exclusion in general liability, the preexisting condition exclusion in certain health products.

    The conditions section defines the policyholder’s obligations — the requirements that must be met for the coverage to apply. The duty to mitigate after a loss, the timely reporting requirement for claims, the cooperation requirement during the claims investigation, and the subrogation rights that the insurer retains after paying a claim are all conditions that affect coverage at claim time. A policyholder who violates a material condition — by failing to report a claim within the required period, by failing to cooperate with the claims investigation, or by settling a third-party claim without the insurer’s consent — may find that the coverage is voided for the specific claim where the condition was violated.

    The definitions section establishes what the policy’s key terms actually mean — and the insurance definitions of common terms frequently differ from the common usage meanings that policyholders assume apply. The insurance definition of flood, occurrence, bodily injury, and professional services all carry specific meanings that affect coverage scope in ways that common usage doesn’t predict. Reading the definitions of the key terms that determine coverage scope prevents the misunderstanding of relying on common usage meanings that the policy doesn’t share.


    Step Six: Verify That the Insurer’s Financial Strength Supports a Long-Term Relationship

    The insurance company’s financial strength is the factor that determines whether the promise behind the premium will be honored — whether the company will have the financial resources to pay the claim when it occurs rather than when the premium was paid. For personal lines coverage where the claim might occur ten or twenty years after the policy is purchased, and for life insurance where the claim might occur thirty or forty years after purchase, the financial strength of the insurer at the time of the claim is more important than the financial strength at the time of purchase.

    AM Best’s financial strength ratings provide the most widely used independent assessment of insurer financial stability — ratings that reflect the company’s reserve adequacy, underwriting quality, investment portfolio, and management strength in a single grade that allows comparing financial strength across insurers. Every insurer being considered for a significant or long-term coverage purchase should carry an AM Best rating of A or better — a threshold that reflects the financial strength required to pay significant claims reliably across a multi-decade coverage period.

    The NAIC complaint ratio — the number of complaints filed against an insurer relative to the insurer’s market share — provides a different dimension of insurer quality that financial strength ratings don’t capture. A financially strong insurer that generates a high volume of complaints relative to its market share may have claims handling practices that produce outcomes that the financial resources could satisfy if the claims process worked correctly — suggesting a service quality problem that the financial strength rating alone doesn’t reveal.


    Step Seven: Evaluate the Total Cost Over the Realistic Coverage Period

    The premium comparison that most insurance evaluations center on reflects one year of coverage cost — which is only the beginning of the financial relationship that an insurance policy represents. The total cost over the realistic coverage period, including renewal pricing that may differ from the initial quote and the potential premium impact of claims filed during the period, produces a more complete cost picture than the annual premium comparison.

    The renewal pricing question is most relevant for insurance lines where introductory pricing differs from renewal pricing — a common pattern with insurers that use competitive initial pricing to acquire customers and recover margin through renewal increases that the policyholder’s switching cost prevents them from fully arbitraging. Asking the insurer specifically about their renewal pricing approach — whether the initial quote reflects the long-term premium or a promotional rate that will increase — produces information that the initial quote doesn’t volunteer.

    The potential premium impact of claims filed during the coverage period is the cost variable that most fundamentally affects the total cost of ownership for insurance — because the surcharges that follow at-fault claims compound the base premium for multiple years in ways that the claim recovery rarely exceeds for small and medium claims. Modeling the total cost of a policy that includes a realistic expectation of one claim over the coverage period — adding the estimated surcharge impact to the premium stream — produces a more accurate total cost comparison than the premium alone for coverage types where claims affect renewal pricing.


    Step Eight: Make the Purchase Decision and Document It

    The purchase decision that follows steps one through seven is an informed one — made with a clear understanding of the risk being covered, the coverage that addresses it, the appropriate coverage amount, the comparative pricing across insurers, the specific policy provisions that determine coverage quality, the insurer’s financial strength, and the total cost over the realistic coverage period. The informed purchase is meaningfully different from the default purchase that most people make — and the difference manifests at claim time rather than at purchase time.

    The documentation step that most buyers skip is preserving the information that supported the purchase decision — the coverage amount rationale, the quote comparison, the policy provisions that were reviewed, and the alternatives that were considered and rejected. This documentation serves two purposes — it provides the reference for the annual review that confirms the coverage still reflects the current situation, and it provides the context for future coverage decisions that build on the foundation established at the initial purchase.


    Choosing the right insurance policy is the foundation — bundling those policies correctly to maximize the discount without sacrificing the competitive pricing that individual policy shopping produces is the optimization layer that applies after the right policies are in place. Our guide on how to bundle your insurance policies the right way — and when bundling actually costs you more covers the bundling decision with enough specificity to identify when the bundling discount produces genuine savings and when it produces the appearance of savings while actually costing more than the unbundled alternative.


    Currently in the process of selecting a new insurance policy — either for the first time or as a replacement for coverage that no longer seems to fit the current situation — and finding that the quote comparison is producing more confusion than clarity? Leave a comment with the coverage type, the specific comparison you’re making, and what’s making the decision difficult. We’ll help you identify which variable is the most important one for your specific situation and how to evaluate it correctly.

  • How to Lower Your Insurance Premium Without Reducing Your Coverage — 11 Legal Strategies That Actually Work

    How to Lower Your Insurance Premium Without Reducing Your Coverage — 11 Legal Strategies That Actually Work

    The instinct to reduce insurance costs by reducing coverage is the most common and most financially dangerous response to premium increases — because it produces lower monthly costs at the expense of the protection that made the insurance worth buying in the first place. The driver who drops liability limits to save $40 per month, the homeowner who removes replacement cost coverage to reduce the annual premium by $200, and the small business owner who lets a professional liability policy lapse between engagements are all making the same mistake — eliminating protection that was providing genuine value in exchange for savings that will be reversed and exceeded the first time a significant claim occurs without adequate coverage in place.

    This guide covers eleven strategies that produce genuine premium reductions without creating coverage gaps — approaches that lower the cost of insurance by reducing the insurer’s risk, improving the information used in rating, or optimizing the coverage structure rather than by reducing the protection the coverage provides.


    Strategy One: Shop Competitively at Every Renewal

    The premium that an insurance company charges at renewal is not necessarily the lowest price available in the market for the same coverage — and the loyalty that most policyholders extend to their current insurer produces a premium that is frequently above what a competitive shopping process would reveal.

    Insurance companies price new business differently from renewal business — new customer acquisition pricing reflects competitive market pressure that renewal pricing doesn’t always match. A policyholder who has been with the same insurer for five years may be paying 15% to 30% more than a new customer with an identical risk profile who switched to the same insurer recently. Shopping coverage at every renewal rather than accepting the renewal premium without comparison produces savings that compound annually for policyholders who find and switch to more competitive alternatives when the differential justifies the switching cost.

    The comparison that produces the most complete picture gets quotes from at least three insurers — including at least one the current insurer doesn’t know is being evaluated — for identical coverage. Identical coverage means the same limits, the same deductibles, the same endorsements, and the same coverage types. A lower premium on different coverage is not a competitive comparison — it’s a coverage trade-off that looks like savings until the coverage difference matters.


    Strategy Two: Raise Deductibles to the Level Your Emergency Fund Supports

    The deductible adjustment is the most direct premium reduction lever available across every insurance category — and the relationship between deductible level and premium is consistent and calculable rather than uncertain. Higher deductibles produce lower premiums. The question is which deductible level produces the best financial outcome for the specific financial situation.

    The correct deductible level is the highest amount that liquid emergency savings can absorb without creating financial hardship — not the highest level available, not the lowest level that feels comfortable, but the amount that reflects the household’s or business’s actual financial resilience at the worst possible moment. A household with $8,000 in accessible emergency savings can rationally carry a $2,500 homeowners deductible — the emergency fund covers the deductible if needed without creating a crisis. The same deductible on a household with $800 in savings produces a payment problem at exactly the moment when the financial pressure of the covered loss is already significant.

    The premium savings from raising deductibles are specific enough to calculate before implementing the change — calling the current insurer and asking for the premium difference between the current deductible and a higher deductible produces the specific savings figure that makes the financial analysis concrete rather than estimated.


    Strategy Three: Bundle Policies With the Same Insurer — But Verify the Math

    The bundling discount — the premium reduction available when multiple policies are purchased from the same insurer — is the most widely advertised insurance saving strategy and the one most frequently accepted without verification that it actually produces net savings.

    The bundling discount is real — typically 5% to 25% on each bundled policy. But whether it produces genuine net savings depends on whether the bundled insurer’s base rates are competitive enough that the discount closes the gap with unbundled alternatives. The insurer offering a 20% bundling discount on homeowners insurance that is 35% more expensive than a competing insurer’s homeowners rate produces a net homeowners cost that is still 15% above the competitor — not savings, despite the advertised discount.

    The verification that most policyholders skip is comparing the total bundled cost against the total unbundled cost of the best available quote for each coverage from the most competitive carrier in each category. When the bundled total is lower, bundle. When the unbundled total is lower, buy each coverage from the most competitive carrier regardless of the bundling discount. The verification takes thirty minutes and produces the correct answer rather than the assumption that bundling always saves money.


    Strategy Four: Improve the Rating Factors That Drive Your Premium

    Insurance premiums are calculated from rating factors that the insurer uses to assess risk — and several of those factors are within the policyholder’s control over time even when they can’t be changed immediately. Improving the controllable rating factors produces premium reductions that compound annually rather than producing a one-time savings.

    Credit score is a rating factor for auto and homeowners insurance in most states — and the relationship between credit improvement and premium reduction is meaningful enough to treat credit improvement as an insurance savings strategy rather than purely a general financial goal. A policyholder who moves from a fair credit tier to a good credit tier may reduce auto insurance premiums by 20% to 40% in states where credit rating is permitted — savings that persist annually rather than requiring repeated action.

    Claims history is the rating factor most directly within the policyholder’s control through the claim filing decision — the choice to file a small claim or pay out of pocket. Every at-fault claim filed creates a claims history record that affects premiums for three to five years. For claims where the recovery is only modestly above the deductible, paying out of pocket preserves the claim-free history and avoids surcharges that may exceed the recovery amount over the surcharge period.

    Driving record affects auto insurance premiums through the violation and accident surcharges that apply for three to five years following the events — surcharges that compound the base rate by 20% to 50% per violation or accident. The premium cost of driving violations extends well beyond the fine and point assessment — modeling the total insurance cost of a speeding ticket over the full surcharge period produces a cost that typically exceeds the fine by a factor of three to five.


    Strategy Five: Claim Every Discount You Qualify For

    The discount gap — the difference between the discounts a policyholder qualifies for and the discounts actually applied to the policy — costs the average policyholder hundreds of dollars annually. Insurers offer discounts willingly but rarely volunteer them proactively — the policyholder who doesn’t ask doesn’t receive discounts that the insurer would apply if asked.

    The systematic discount audit that produces the most complete discount capture asks specifically about each major discount category rather than asking generally whether discounts are available. The categories worth asking about specifically include good driver and claim-free discounts for auto and home, professional and organizational affiliation discounts across all lines, safety device and security system discounts for auto and home, defensive driving course discounts for auto, loyalty discounts for multi-year policyholders, and administrative discounts for paperless billing and autopay enrollment.

    The affinity discount category is the most frequently unclaimed — many employers, professional associations, alumni organizations, and military service organizations have negotiated insurance discounts that members qualify for without knowing the discount exists. Asking the insurer specifically about affiliation discounts for each organizational membership produces the information needed to claim discounts that may not appear in the online quote process without the specific prompt.


    Strategy Six: Eliminate Coverage That No Longer Applies to Your Situation

    The coverage portfolio that was appropriate at an earlier life stage may include coverage types that no longer address genuine financial exposures — and eliminating coverage that doesn’t apply to the current situation produces premium savings without creating coverage gaps because the protection was already providing no practical value.

    Collision and comprehensive coverage on a vehicle whose value has depreciated to the point where the maximum insurance payout — actual cash value minus deductible — is smaller than the annual premium multiplied by the expected holding period is the most common example of coverage that no longer justifies its cost. A vehicle worth $3,500 with a $1,000 deductible and $700 annual collision and comprehensive premium produces a maximum net payout of $2,500 that requires only 3.6 years of premium to exceed — suggesting that self-insuring the remaining vehicle value through emergency savings produces better expected financial outcomes than continuing the coverage.

    Rental car reimbursement coverage on a household with multiple vehicles is coverage that provides minimal practical value — the household can use another vehicle during repairs rather than needing a rental reimbursement. Roadside assistance coverage on a vehicle already covered by a membership service like AAA duplicates a benefit already paid for through the membership fee. Each of these coverage types represents premium spending with limited practical benefit that, when identified specifically, produces savings through elimination rather than through coverage reduction.


    Strategy Seven: Install Safety and Security Features

    The safety and security devices that reduce the probability or severity of covered losses also reduce the premium that insurers charge for the coverage — because the insurer’s expected claim cost is lower for properties and vehicles with effective loss prevention features.

    Home security systems that include professional monitoring produce homeowners insurance discounts of 5% to 20% at most major insurers — reflecting the actuarial reduction in theft claim frequency for monitored properties relative to unmonitored ones. The annual discount typically exceeds the annual monitoring cost for security systems at the lower end of the monitoring fee range, producing a net financial benefit from the security system installation beyond the direct security benefit.

    Vehicle safety features that reduce accident frequency and severity produce auto insurance discounts that vary by insurer and feature type. Anti-lock brakes, airbags, automatic emergency braking, lane departure warning, and blind spot monitoring all produce discounts that reflect the actuarial reduction in accident frequency and injury severity associated with each feature. For vehicles purchased without confirming that available safety discounts are applied to the policy, specifically requesting the safety feature discount review produces savings without any additional investment.

    Business safety programs for workers compensation produce the most significant safety investment return in the insurance cost context — because the experience modification improvement from reduced claims compounds annually across the modification calculation period. A safety investment that reduces workers compensation claims by 30% produces an experience modification improvement that reduces the workers compensation premium by 15% to 20% annually for several years following the claims reduction.


    Strategy Eight: Review Coverage Limits for Accuracy

    Coverage limits that are set above the actual financial exposure they’re designed to protect produce premiums for excess protection that would never be needed — and adjusting limits to reflect the actual exposure eliminates excess premium without reducing the protection that addresses genuine financial risk.

    Life insurance coverage that exceeds the actual income replacement and financial dependency needs produced by the DIME or needs analysis calculation is the most common over-coverage example — the policyholder who purchased $1.5 million in coverage when the needs analysis supports $800,000 is paying premiums for $700,000 in excess coverage that would never produce a benefit beyond what the $800,000 policy provides. Adjusting the coverage to the accurate amount eliminates the excess premium while maintaining the full protection the actual financial dependency requires.

    Personal property coverage on a homeowners or renters policy that is set at a percentage-based default rather than an actual inventory-based calculation may be over or under the actual replacement cost of the contents — and in either direction, correcting the inaccuracy produces either premium savings from reducing excess coverage or better protection from increasing inadequate coverage. The home inventory that produces accurate personal property coverage reflects the actual replacement cost of the contents rather than a formula-based approximation.


    Strategy Nine: Enroll in Usage-Based and Telematics Programs

    Usage-based insurance programs — telematics programs that monitor driving behavior for auto insurance and usage-based pricing for other coverage types — produce premium adjustments based on actual behavior rather than demographic proxies that may overstate the risk for policyholders whose actual behavior is lower-risk than their demographics suggest.

    Auto insurance telematics programs that monitor acceleration, braking, speed, mileage, and time of day produce discounts for drivers whose monitored behavior confirms the low-risk profile that standard underwriting factors don’t fully reflect. A driver whose demographics suggest elevated risk — a young driver, a driver in a high-accident urban area — but whose actual driving behavior is consistently safe may receive telematics discounts that bring the premium to a level that the demographic factors alone would never produce.

    The low mileage discount that applies for drivers who drive fewer miles annually than the insurer’s standard assumption is one of the most straightforward usage-based savings for remote workers, retirees, and others whose annual mileage is significantly below the national average. Reporting actual mileage rather than accepting the default mileage assumption produces a premium that reflects the lower exposure rather than the standard exposure.


    Strategy Ten: Pay Annually and Go Paperless

    The administrative discounts that insurers offer for reducing their processing costs — paperless billing enrollment, automatic payment setup, and annual premium payment rather than monthly installments — are the easiest discounts to claim and the ones most frequently overlooked because they don’t require any underwriting action.

    The annual payment discount eliminates the installment fees that monthly billing adds — typically $3 to $8 per payment — which compounds to $36 to $96 per year on a monthly-pay policy. For policyholders whose cash flow allows the annual payment, the fee elimination produces a guaranteed savings that doesn’t depend on claims experience, market conditions, or insurer decisions. The paperless billing and autopay discounts add modest additional savings — typically $2 to $10 per coverage per year — that accumulate across multiple policies to a meaningful annual amount.


    Strategy Eleven: Conduct an Annual Coverage Audit

    The annual coverage audit — a systematic review of every active insurance policy against current circumstances, current asset values, and current financial exposure — is the strategy that prevents the premium from growing through accumulation of coverage that no longer applies rather than through market price increases.

    The audit identifies three types of coverage inefficiency that compound annually if left unaddressed — excess coverage that insures above the actual financial exposure, redundant coverage that duplicates protection already provided by another policy, and obsolete coverage that addresses risks that no longer exist for the current situation. Each inefficiency represents premium spending that produces no additional protection value and that the audit identifies and eliminates.

    The annual audit also identifies coverage gaps — risks that have emerged through life changes, business growth, or asset acquisition that are not addressed by the current coverage portfolio. Catching gaps before a claim makes them relevant is the protective value of the audit alongside the cost savings from eliminating inefficiencies — together producing a coverage portfolio that is both adequate and efficient rather than either over-insured at too high a cost or under-insured at too high a risk.


    Applying these premium reduction strategies across every insurance category requires knowing which policies to review and how to structure the coverage audit that produces the most complete picture of the current insurance portfolio. Our guide on the complete insurance audit — how to review all your policies once a year and save money every time covers the step-by-step audit process that applies these strategies systematically rather than in isolation, producing the cumulative savings that reviewing each policy independently doesn’t capture as completely.


    Applied one of these strategies and found that the savings were significantly larger or smaller than expected — or tried to negotiate a discount that the insurer declined without a clear explanation of why? Leave a comment with the specific strategy, the coverage type, and what happened. Real experiences with specific discount and savings approaches help other policyholders understand what to expect when applying the same strategy to their own coverage.

  • Workers Compensation Insurance Explained: What It Is, Who Needs It, and How to Buy It Right

    Workers Compensation Insurance Explained: What It Is, Who Needs It, and How to Buy It Right

    Workers compensation insurance is the coverage category that most small business owners think about least until the moment they need it — and at that moment, whether the coverage is in place, structured correctly, and adequate for the specific injury or illness determines whether a workplace incident produces a managed insurance response or a personal financial crisis that threatens both the business and the owner’s personal assets. The legal requirement that workers compensation represents for most businesses with employees is reason enough to take it seriously — but the financial protection it provides for both the injured employee and the business owner is the more compelling reason to understand it rather than simply purchasing the minimum required coverage without knowing what that coverage actually does.


    What Workers Compensation Insurance Actually Is

    Workers compensation insurance is a no-fault system for addressing workplace injuries and occupational illnesses — a coverage structure that compensates injured employees for medical expenses and lost wages without requiring them to prove that the employer was negligent, and that protects employers from the tort liability that would otherwise apply to workplace injuries by providing an exclusive remedy for covered injuries through the workers compensation system.

    The no-fault structure is the defining characteristic that distinguishes workers compensation from every other liability coverage — there is no fault determination, no litigation over who was responsible for the injury, and no requirement for the injured employee to prove employer negligence. An employee who is injured on the job — regardless of how the injury occurred, whether through their own carelessness, a coworker’s error, or equipment failure — is entitled to workers compensation benefits if the injury arose out of and in the course of employment.

    The exclusive remedy doctrine that accompanies workers compensation in most states is the trade-off that makes the no-fault system function for both parties. By accepting workers compensation benefits, the injured employee typically gives up the right to sue the employer in tort for the workplace injury — the workers compensation benefit is the exclusive remedy available against the employer for covered injuries. This protection — which limits the employer’s liability for workplace injuries to the workers compensation system rather than exposing the employer to unlimited tort liability — is the financial protection that workers compensation provides to the business alongside the benefit it provides to the injured employee.


    What Workers Compensation Benefits Actually Cover

    The benefits that workers compensation provides to injured employees are defined by state law rather than by the insurance policy — which means the specific benefit levels, waiting periods, and duration limits vary by state in ways that make state-specific knowledge essential for understanding the actual benefits available in any particular jurisdiction.

    Medical benefits cover all reasonable and necessary medical treatment for work-related injuries and illnesses — physician visits, hospital care, surgery, physical therapy, prescription medications, and medical equipment needed for the injury. Medical benefits are provided without a deductible and without a copayment in most states — the workers compensation insurer pays the medical provider directly rather than requiring the employee to pay and seek reimbursement. The medical benefit is not subject to a dollar limit in most states — all reasonable and necessary treatment for the covered injury is covered regardless of the total medical cost.

    Temporary disability benefits replace a portion of the injured employee’s lost wages during the period when the injury prevents them from working — typically two-thirds of the pre-injury average weekly wage up to a state-determined maximum. The temporary disability benefit begins after a waiting period — typically three to seven days — and continues until the employee returns to work at full or modified duty, reaches maximum medical improvement, or exhausts the maximum benefit duration allowed by state law. The waiting period for most states is retroactively compensated if the disability extends beyond a specified duration — typically fourteen to twenty-one days — which means short absences may not receive temporary disability benefits while extended absences receive benefits from the first day.

    Permanent disability benefits address the lasting impairment that some workplace injuries produce — the reduced earning capacity or physical limitation that remains after maximum medical improvement is reached. Permanent disability benefits are calculated using a combination of the medical impairment rating produced by the treating physician, the employee’s age and occupation, and the state’s benefit schedule — producing a dollar amount that compensates for the permanent reduction in the employee’s earning capacity or physical function.

    Death benefits provide compensation to the surviving dependents of employees who die from work-related injuries or illnesses — typically a portion of the deceased employee’s pre-injury wages paid for a specified period to qualifying survivors and a burial expense benefit that covers the cost of the funeral.


    Who Is Required to Carry Workers Compensation

    The legal requirement to carry workers compensation insurance varies by state in the employee threshold that triggers the requirement — and understanding the specific threshold that applies in the relevant state prevents both the compliance failure that occurs when a business assumes it’s exempt and the unnecessary cost that occurs when a business purchases required coverage it doesn’t need.

    Most states require workers compensation insurance when the first employee is hired — which means the hiring decision and the workers compensation purchase decision occur simultaneously rather than sequentially. The states with higher employee thresholds — which allow small businesses to operate with a small number of employees before the workers compensation requirement triggers — are the exception rather than the rule, and the specific threshold for each state is specific enough to verify directly rather than assume from general knowledge.

    The employee versus independent contractor distinction is the most common source of workers compensation compliance risk for small businesses — the business that treats workers as independent contractors to avoid the workers compensation requirement faces significant exposure if those workers are later determined to be employees under the state’s classification rules. The classification determination is based on the degree of control the business exercises over the worker’s activities rather than the label that the parties apply to the relationship — a worker who is functionally an employee is classified as an employee for workers compensation purposes regardless of how the business characterizes the relationship in the contractor agreement.

    Industry-specific requirements affect the workers compensation obligation for certain business types in specific states — construction contractors, for example, are subject to workers compensation requirements in most states even when working as sole proprietors without employees, because the high-risk nature of construction work and the history of misclassification in the construction industry have produced regulatory requirements that go beyond the standard employee threshold rules.


    How Workers Compensation Premiums Are Calculated

    The workers compensation premium calculation is more complex than the flat-rate pricing of most other insurance products — and understanding the calculation allows evaluating whether the premium reflects accurate business information rather than accepting a calculated premium without knowing how it was derived.

    The class code is the foundation of the premium calculation — each job classification is assigned a numerical code that reflects the injury frequency and severity history for that type of work. The class code rate — expressed as a dollar amount per $100 of payroll — reflects the actuarial cost of providing workers compensation benefits to the specific occupation. A clerical worker class code might carry a rate of $0.25 per $100 of payroll while a roofing contractor class code might carry a rate of $25 or more per $100 of payroll — a one-hundred-fold difference that reflects the dramatically different injury probability and medical cost associated with each occupation.

    The payroll — specifically, the total compensation paid to employees in each class code — is the rating base that is multiplied by the class code rate to produce the base premium. The payroll figure used in the calculation should reflect the actual payroll rather than estimated payroll — workers compensation policies are typically written on an estimated payroll basis and audited at year-end to adjust the premium for the actual payroll that was paid during the policy period. The audit adjustment that results from a payroll that was higher than estimated produces an additional premium that the business must pay — and a payroll that was lower than estimated produces a return premium.

    The experience modification factor — the comparison of the business’s actual claims history against the expected claims for similar businesses — applies as a multiplier to the base premium once the business has accumulated sufficient claims history to generate a calculated modification. A modification below 1.0 reduces the premium while a modification above 1.0 increases it — and the modification compounds across years of favorable or unfavorable claims experience to produce cumulative premium credits or surcharges that can be significant.


    The Audit Process That Most Business Owners Don’t Anticipate

    The workers compensation audit — the annual review of the actual payroll that was paid during the policy period — is a process that most first-time workers compensation buyers don’t know to expect and that produces unexpected premium adjustments when the actual payroll differs significantly from the estimated payroll used to calculate the deposit premium.

    The audit is not optional — it’s a standard condition of workers compensation policies that allows the insurer to adjust the premium for the actual exposure rather than the estimated exposure. The audit typically occurs within ninety days after the policy period ends and involves the insurer or an audit firm reviewing the business’s payroll records, tax filings, and employee records to verify the actual payroll in each classification.

    The payroll classification accuracy that the audit reviews is the most financially significant component — because payroll that is classified in an incorrect class code at a lower rate than the actual work warrants produces both an audit adjustment and potentially an allegation of misrepresentation that can affect future coverage. A contractor who classifies all workers as clerical to minimize premiums — a practice that audits consistently identify — faces an audit adjustment that retroactively applies the correct class code rate to the misclassified payroll, plus the potential for policy cancellation and difficulty obtaining future coverage.

    The documentation that supports audit accuracy includes payroll records by employee, time records that distinguish work in different classifications if employees perform work in multiple categories, subcontractor certificates of insurance that exclude subcontractor payroll from the business’s audit base, and any other records that verify the actual payroll in each classification.


    How to Buy Workers Compensation Correctly

    The workers compensation purchasing process produces the best outcome when it follows a sequence that establishes accurate classification and payroll information before obtaining quotes rather than accepting the first quote received without verifying that it reflects accurate underlying data.

    Identifying the correct class codes for the specific employees and work activities is the first step — the National Council on Compensation Insurance maintains the class code system used by most states, and the specific codes that apply to each type of work are specific enough to verify directly rather than accept from an insurer who may apply a conservative classification that produces a higher rate than the accurate classification would.

    Obtaining quotes from multiple insurers — the state workers compensation fund if available, private insurers through a broker, and the professional employer organization model if the business size and structure make PEO coverage appropriate — produces the comparison that identifies competitive pricing rather than accepting a single quote as the market rate.

    Verifying that subcontractors the business uses carry their own workers compensation coverage is the step that prevents the most expensive workers compensation audit surprise — because the payroll of uninsured subcontractors is frequently added to the business’s audit base by the insurer, producing a retroactive premium adjustment for payroll the business owner didn’t expect to insure.


    The Safety Program That Reduces Workers Compensation Cost Over Time

    The experience modification factor that compounds across years of claims experience makes the safety program the most impactful long-term workers compensation cost reduction strategy — because a reduction in claim frequency and severity improves the experience modification over time, which reduces the premium multiplicatively rather than through a one-time discount.

    The safety investment that produces the best return in workers compensation cost reduction is the specific hazard identification and mitigation that addresses the injury types most common in the specific industry — not a generic safety program that addresses a broad range of hazards regardless of relevance, but a focused program that targets the specific injury mechanisms that produce the most frequent and most costly claims for the specific business type. For a contractor, that focus is fall protection and tool safety. For a warehouse operation, it’s lifting technique and forklift safety. For a healthcare provider, it’s patient handling and sharps safety.

    The return-to-work program that facilitates injured employees returning to modified duty during their recovery — performing work that accommodates the physical restrictions of the recovery period rather than being completely absent during the recovery — reduces temporary disability costs significantly by shortening the period of wage replacement that the insurer must provide. The return-to-work program’s financial benefit extends to the experience modification — reduced temporary disability costs produce lower total claim costs that improve the modification over time.


    Workers compensation is the last of the business insurance coverages that most small businesses need to address — completing the coverage portfolio that protects the business from the full range of financial exposures it faces. Our guide on how to lower your insurance premium without reducing your coverage — 11 legal strategies that actually work covers the premium reduction strategies that apply across all insurance categories including business insurance, with enough specificity to identify which approaches produce the most meaningful savings for each coverage type in the specific business situation.


    Currently employing workers without workers compensation coverage — or carrying workers compensation but uncertain whether the class codes and payroll figures used in the calculation are accurate enough to avoid an audit adjustment? Leave a comment with your state, the number of employees, and the type of work they perform. We’ll help you identify whether your current coverage is compliant and whether the classification and premium calculation reflects the accurate risk profile for your specific workforce.

  • How Much Does Small Business Insurance Cost in 2026 — The Honest Breakdown by Industry

    How Much Does Small Business Insurance Cost in 2026 — The Honest Breakdown by Industry

    The small business insurance cost question produces answers that range from $400 to $40,000 per year depending on variables that the question doesn’t specify — which makes the generic answer that most insurance content provides genuinely unhelpful for a business owner trying to budget for coverage or evaluate whether a quote they received is reasonable. Business type, revenue, employee count, coverage types, limits, claims history, and geographic location all affect the premium independently and in combination, producing a cost range that only becomes useful when the relevant variables are specified.

    This guide provides specific premium ranges organized by industry and coverage type — the numbers that allow a small business owner to locate the relevant range for their specific situation and evaluate quotes against market benchmarks rather than accepting a premium without knowing whether it reflects competitive pricing or a significant markup above what the market would produce.


    The Variables That Drive Small Business Insurance Premiums

    Before the industry-specific ranges, establishing which variables produce the most significant premium differences prevents the mistake of applying a range that was accurate for a different business profile to a situation where it produces a misleading reference point.

    Business type is the most significant premium driver across all coverage categories — the industry classification that the insurer assigns to the business determines the base rate that applies before any individual risk factors are considered. The base rate reflects the actuarial loss history for the industry — the frequency and severity of claims across all businesses in that classification — which produces dramatically different base rates for a home-based consulting firm and a roofing contractor despite similar revenue levels.

    Revenue and payroll are the rating bases that most commonly determine the premium for general liability and workers compensation respectively — the more revenue generated or payroll processed, the higher the exposure and therefore the higher the premium. The relationship between revenue and premium is not linear — premium scales with revenue but at a declining rate per revenue dollar as the business grows, reflecting the actuarial reality that larger businesses don’t always produce proportionally more claims than smaller ones.

    Claims history affects premiums through the experience modification factor — the comparison of the business’s actual claims history against the expected claims for similar businesses of similar size. A business with fewer claims than expected for its profile receives a credit modification that reduces the base premium. A business with more claims than expected receives a debit modification that increases it. For new businesses without claims history, the experience modification defaults to 1.0 — neither credit nor debit — until sufficient claims history accumulates to produce a calculated modification.

    Geographic location affects premium through state-specific rate filings and local risk factors — workers compensation rates vary significantly by state based on benefit levels and loss experience, general liability rates reflect local litigation environments and jury award levels, and commercial property rates reflect local catastrophe exposure from weather events, crime rates, and construction costs.


    General Liability Premium Ranges by Business Type

    The general liability premium ranges below reflect 2026 market pricing for $1 million per occurrence and $2 million aggregate limits — the standard baseline limits that most commercial leases and client contracts require. The ranges reflect the variation across geographic markets and business profiles within each industry category rather than national averages.

    Home-based consulting and professional services businesses — management consultants, marketing consultants, financial advisors, coaches — with no physical client-facing premises and annual revenues below $500,000 typically pay $400 to $700 per year. The low end of the range applies to virtual-only businesses with no physical client interaction and no product sales. The higher end applies to businesses with occasional client visits or in-home office setups where visitors are present.

    Retail stores — clothing, gifts, specialty food, and similar consumer retail — with annual revenues of $250,000 to $500,000 typically pay $750 to $1,500 per year. The range reflects the customer traffic exposure that retail creates and varies by the specific product category — higher-risk products like sporting goods or tools produce higher rates than lower-risk categories like clothing or books.

    Restaurants and food service businesses — full-service restaurants, cafes, catering companies, food trucks — typically pay $1,500 to $4,000 per year for general liability reflecting the elevated bodily injury exposure from food service operations, the liquor liability exposure for establishments that serve alcohol, and the products liability exposure from food preparation.

    Contractors and tradespeople — general contractors, electricians, plumbers, HVAC technicians, painters — typically pay $2,000 to $8,000 or more per year depending on the specific trade, annual revenue, and payroll. The wide range reflects the significant variation in liability exposure across contractor types — a residential painter faces different exposure than a structural contractor, and the premium reflects that difference.

    Healthcare and wellness businesses — physical therapists, massage therapists, personal trainers, yoga studios — typically pay $1,200 to $3,000 per year for general liability with the professional liability component often bundled or purchased separately. The bodily injury exposure from hands-on services and the physical training environment produces rates above the standard professional services baseline.

    Technology and software businesses — software developers, IT consultants, web developers, app developers — typically pay $500 to $1,200 per year for general liability with professional liability as the primary coverage concern. The general liability exposure for most technology businesses is limited to standard premises and advertising liability — the professional services exclusion removes the most significant technology liability from general liability coverage entirely.


    Professional Liability Premium Ranges by Business Type

    Professional liability premiums reflect the specific professional service being insured, the revenue generated from professional services, the claims history in the profession, and the coverage limits selected — variables that produce wider ranges within each profession than the general liability ranges reflect.

    Management consultants and business advisors with annual revenues below $500,000 typically pay $600 to $1,200 per year for $1 million in professional liability coverage. The range reflects the specific advisory services being provided — strategic advisory services produce different rates than operational implementation services — and the client size that the consultant serves, with larger client engagements creating higher potential claim values that the underwriter reflects in the rate.

    Marketing agencies and creative services businesses with annual revenues of $250,000 to $750,000 typically pay $700 to $1,500 per year for professional liability at $1 million limits. The advertising injury exposure that marketing services create — intellectual property infringement, defamation in marketing materials — is reflected in the rate alongside the standard professional services exposure.

    Technology companies and software developers with annual revenues of $500,000 to $1.5 million typically pay $1,000 to $2,500 per year for professional liability. The technology errors and omissions exposure — software failures, data loss, system downtime — produces rates that reflect the financial impact that technology failures can create for clients who rely on the covered software or systems.

    Accountants and bookkeepers with annual revenues below $300,000 typically pay $800 to $1,800 per year for professional liability — reflecting the financial harm exposure that accounting errors, tax advice mistakes, and financial reporting errors create for clients who rely on the professional’s work for significant financial decisions.

    Attorneys face some of the highest professional liability premiums in the professional services category — reflecting the litigation-intensive nature of legal errors and the high-value financial harm that legal mistakes produce for clients. A solo practitioner attorney might pay $2,000 to $5,000 per year for professional liability depending on the practice area — personal injury defense and real estate practices at the lower end, securities law and complex commercial litigation at the higher end.

    Healthcare providers including physicians, dentists, and chiropractors face malpractice insurance premiums that reflect the bodily injury nature of medical errors alongside the professional services exposure — a combination that produces rates significantly higher than other professional service categories. A primary care physician might pay $5,000 to $15,000 per year for malpractice coverage depending on the state, the specialty, and the claims history — with surgical specialties and high-risk states producing premiums at the upper end of a significantly wider range.


    Workers Compensation Premium Ranges

    Workers compensation premiums are calculated differently from general and professional liability — expressed as a rate per $100 of payroll for each job classification rather than as a flat premium for a coverage limit. The rate varies by classification from below $0.50 per $100 of payroll for low-risk clerical and professional work to $20 or more per $100 of payroll for high-risk construction and roofing work.

    A professional services business with $200,000 in annual payroll in clerical and professional classifications might pay $0.40 to $0.80 per $100 of payroll — an annual workers compensation premium of $800 to $1,600. The same payroll in a landscaping classification might produce a rate of $8 to $12 per $100 — an annual premium of $16,000 to $24,000. The rate difference between the lowest and highest risk classifications is large enough to make the classification assignment the most important variable in workers compensation pricing — and an incorrect classification that applies too high a rate creates an overcharge that is recoverable through an audit.

    The experience modification that applies after the first few years of coverage reflects the business’s actual claims history relative to similar businesses — a modification below 1.0 reduces the premium and a modification above 1.0 increases it. A business with a modification of 0.85 pays 15% below the base rate — a meaningful savings that reflects the actuarial credit for better-than-average claims experience. A business with a modification of 1.25 pays 25% above the base rate — a surcharge that reflects worse-than-average claims history and that compounds annually if the claims experience doesn’t improve.


    Business Owner’s Policy Premium Ranges

    The business owner’s policy — the bundled general liability and commercial property package — typically costs less than the two coverages purchased separately, producing a combined premium that represents the most cost-effective starting point for most small businesses.

    A home-based or very small office-based business with minimal property and standard liability limits might pay $500 to $900 per year for a BOP. A retail store with $100,000 to $250,000 in business personal property and standard liability limits might pay $1,200 to $2,500 per year. A restaurant with significant business property and elevated liability exposure might pay $2,000 to $5,000 per year for a BOP that bundles the property and liability coverage at combined limits appropriate for the operation.

    The property component of the BOP adds to the premium in proportion to the insured property value — a business with $500,000 in equipment and inventory insures significantly more property than a service business with $20,000 in office equipment, and the premium reflects that difference. The business interruption coverage included in most BOPs adds a further component that reflects the revenue and fixed expense exposure during the interruption period — larger revenue operations face higher business interruption exposure and pay proportionally higher premiums for that component.


    How to Evaluate Whether a Quote Is Competitive

    The premium ranges above provide a market reference — but evaluating whether a specific quote is competitive requires comparing it against the ranges for the specific business type and verifying that the quote reflects accurate business information rather than conservative assumptions that inflate the premium above what accurate underwriting would produce.

    The most common source of inflated small business insurance quotes is the business classification — an insurer that assigns a higher-risk classification than the actual operations warrant applies a higher base rate that produces a premium above the competitive range for the actual business type. Reviewing the classification that the insurer applied to the business and verifying that it accurately reflects the primary operations is the first step in evaluating whether the premium reflects competitive pricing.

    The revenue or payroll figures used in the rating are the second verification — because a quote based on overstated revenue or payroll produces a premium above what accurate figures would generate. Confirming that the insurer used accurate revenue or payroll figures produces the correct rating basis for the premium calculation.

    Getting quotes from at least three insurers — including a digital-first option, a traditional insurer, and the current insurer if coverage is already in place — produces the comparison set that identifies whether the lowest quote reflects the market rate or a coverage quality trade-off that makes the lower premium less appropriate than a slightly higher alternative.


    Understanding what business insurance costs is the foundation for budgeting — understanding how workers compensation insurance specifically works and who is legally required to carry it provides the detail that the cost breakdown above only partially addresses. Our guide on workers compensation insurance explained — what it is, who needs it, and how to buy it right covers the specific requirements, rate calculation, and purchasing process for the coverage category that affects every small business the moment the first employee joins the payroll.


    Received a small business insurance quote that seems higher than the ranges in this guide suggest — or carrying coverage that was last priced more than two years ago and wondering whether the current premium reflects market rates or a renewal markup that a fresh comparison would reduce? Leave a comment with your business type, annual revenue, employee count, and the coverage types in the quote. We’ll help you identify whether the pricing is within the competitive range or whether a comparison is likely to produce meaningful savings.

  • Professional Liability vs General Liability: Which One Does Your Business Need

    Professional Liability vs General Liability: Which One Does Your Business Need

    Professional liability and general liability are the two insurance coverages that appear most consistently on small business insurance checklists — and they’re the two that are most consistently confused with each other, purchased incorrectly, or purchased exclusively when both are actually needed. The confusion is understandable because the names suggest a hierarchy — professional liability sounds more comprehensive than general liability, and general liability sounds like it should cover everything generally — when in reality the two coverages address fundamentally different types of claims and leave genuinely different gaps when either is absent.

    Understanding the distinction between them is not an academic exercise — it’s the foundation of a coverage decision that determines whether a business claim produces an insurance response or a personal financial obligation. The business that carries only general liability when its operations require professional liability discovers the gap the moment a professional liability claim occurs. The business that carries only professional liability when it also has general liability exposure is equally exposed in the other direction. Getting the combination right requires understanding what each coverage actually does.


    The Fundamental Difference That Explains Everything

    The most useful way to understand the difference between general liability and professional liability is through the type of harm each coverage addresses — because the distinction between physical harm and financial harm is the underlying logic that separates the two coverages.

    General liability insurance addresses claims arising from physical harm — bodily injury and property damage that results from the business’s operations, premises, or products. The harm is tangible and visible — a person is physically injured, property is physically damaged. The connection between the business’s action or inaction and the physical harm is the legal basis for the liability claim, and the general liability policy is the coverage that responds when that connection is established.

    Professional liability insurance addresses claims arising from financial harm — the purely economic loss that a client or third party suffers as a result of the business’s professional advice, professional services, or professional errors. No physical injury or property damage is required for a professional liability claim — the harm is the financial consequence of relying on incorrect advice, inadequate services, or a professional mistake that produced a financial loss for the client. The connection between the professional’s expertise and the client’s financial loss is the legal basis for the claim, and the professional liability policy is the coverage that responds.

    The professional services exclusion in every general liability policy is the mechanism that enforces this separation — the exclusion specifically removes coverage for bodily injury and property damage that results from the rendering or failure to render professional services. This exclusion means that even when a general liability policy is in place, claims that arise specifically from professional services are excluded — leaving the professional services business without coverage for its most significant liability exposure unless a separate professional liability policy is also in place.


    What General Liability Covers for Service Businesses

    For service businesses that provide professional services, general liability still provides meaningful coverage for the non-professional-services liability exposures that exist alongside the professional services exposure — and understanding what general liability covers for this type of business clarifies why both coverages are typically needed rather than one being redundant.

    The premises liability that general liability provides — coverage for injuries that occur on the business’s premises or at a client’s location during business operations — is relevant for professional service businesses that have physical offices, that conduct client meetings, or that visit client locations. A client who visits the consulting firm’s office and trips on a step, a designer who accidentally damages a client’s property while setting up for a meeting, a freelancer whose rented workspace creates a hazard for a visiting vendor — each of these scenarios involves physical harm that the general liability policy addresses regardless of the professional services exclusion.

    The advertising injury coverage that general liability provides is relevant for professional service businesses that produce marketing content, operate social media accounts, or use creative material in business development. Copyright infringement in advertising, defamatory statements in business communications, and certain other non-physical harm categories that fall under the personal and advertising injury coverage are addressed by the general liability policy — which extends the general liability’s coverage beyond purely physical harm for these specific defined scenarios.

    The products liability coverage that general liability provides is relevant for professional service businesses that also sell physical products alongside their services — a software consultancy that sells proprietary software tools, a design firm that produces physical merchandise, a coaching business that sells physical training materials. The product liability component of general liability addresses the bodily injury and property damage claims that might arise from those physical products.


    What Professional Liability Covers That General Liability Doesn’t

    The professional liability coverage fills the gap that the general liability professional services exclusion creates — and the scenarios where professional liability is the only applicable coverage are specific enough to describe rather than leaving them as theoretical examples.

    A client who hired a marketing consultant to develop a campaign strategy that underperformed and resulted in demonstrable financial loss files a professional liability claim — not a general liability claim — because no physical harm occurred. The general liability policy’s professional services exclusion explicitly removes this scenario from coverage. The professional liability policy covers the defense costs and any judgment or settlement that results from the negligent professional advice claim.

    An accountant whose tax advice led a client to underpay taxes resulting in penalties and interest faces a professional liability claim for the financial consequences of the tax advice error. The harm is purely financial — no physical injury, no property damage — and the general liability policy’s exclusion of professional services removes the claim from general liability coverage entirely. The professional liability policy is the only coverage that responds.

    A technology developer whose software product contained errors that produced financial losses for the business clients using the software faces professional liability claims from those clients. The errors in the software represent a professional failure — the inadequate professional service of software development — rather than a physical product defect that would produce a general liability products liability claim. The professional liability policy covers the financial harm claims while the general liability policy would cover any physical harm that resulted from the same software failure.


    The Claims-Made vs Occurrence Structure That Affects Both Coverages Differently

    General liability and professional liability policies use different coverage trigger structures — and understanding the difference is essential to managing coverage continuity correctly rather than discovering a coverage gap when a claim is filed.

    General liability policies are almost universally written on an occurrence basis — which means coverage applies to claims arising from events that occurred during the policy period, regardless of when the claim is actually filed. A general liability policy in force during 2024 covers a bodily injury that occurred in 2024 even if the injured party doesn’t file a claim until 2026 — because the occurrence happened during the coverage period, and the occurrence-based policy covers events that occurred during the period regardless of when they’re reported.

    Professional liability policies are typically written on a claims-made basis — which means coverage applies to claims that are made and reported during the policy period, regardless of when the underlying professional error occurred, subject to a retroactive date that limits coverage to errors occurring after a specified date. A professional liability policy in force during 2026 covers claims reported in 2026 for professional errors that occurred any time after the retroactive date — but does not cover claims reported after the policy expires, regardless of when the underlying error occurred.

    The practical consequence of the claims-made structure is that coverage continuity is critical for professional liability — a policy that lapses without a tail coverage endorsement or replacement policy with a retroactive date covering the gap leaves the professional exposed to claims that arise after the policy expires for errors that occurred while the policy was in force. The business owner who cancels a professional liability policy at the end of a client engagement without purchasing a tail endorsement may face a professional liability claim from that engagement years later with no coverage in place.


    Which Businesses Need Both, Which Need Only One, and Why

    The business type determines whether both coverages are needed, whether one is sufficient, or whether neither addresses the primary exposure — and the determination is specific enough to make for common business types without excessive qualification.

    Businesses that need both general liability and professional liability include every professional service business that also has physical operations, client-facing premises, or physical product sales alongside the professional services. The consulting firm, the marketing agency, the accounting practice, the technology services company, the architectural firm, and the legal practice all face both the professional services liability exposure that professional liability addresses and the premises, products, and advertising liability exposure that general liability addresses. Neither coverage alone is sufficient — both are needed to address the full range of liability exposure these businesses face.

    Businesses that need general liability but may not need professional liability include businesses whose primary operations involve physical products, physical services, or physical locations rather than professional advice or expertise. A retail store, a restaurant, a landscaping company, a cleaning service — each of these businesses has significant general liability exposure from their physical operations but limited professional liability exposure from the exercise of professional expertise. The professional liability exposure for these businesses exists in a limited form — a cleaning service that recommends a cleaning product that damages a client’s surface has some professional advice exposure — but it’s typically addressable within the general liability coverage for less complex service businesses rather than requiring separate professional liability coverage.

    Businesses that need professional liability as the primary coverage and general liability as supplementary include home-based professional service businesses with no physical client-facing premises and no physical product sales — a solo freelance writer, a virtual assistant, a remote software developer. The professional liability exposure from the professional services is the primary exposure, and the general liability exposure from premises and physical operations is minimal given the home-based, virtual nature of the work. Both coverages are still worth carrying — general liability premiums for home-based businesses are modest enough that the coverage it provides is worth the premium — but the professional liability is the primary coverage that addresses the most significant financial exposure.


    The Limits Decision That Applies Differently to Each Coverage

    The coverage limits decision for general liability and professional liability reflects different risk considerations — and applying the same limit to both without evaluating the specific claim scenarios each coverage addresses produces a coverage structure that may be adequate in one area and inadequate in the other.

    General liability limits are typically set at $1 million per occurrence and $2 million aggregate as a standard baseline — a limit structure that reflects the most common claim scenarios and that satisfies the requirements of most commercial leases and client contracts. Businesses with elevated bodily injury exposure — higher customer traffic, physical service delivery, or products that create injury risk — may need higher occurrence limits and a personal umbrella or commercial excess policy above the general liability limits.

    Professional liability limits reflect the financial harm scenarios that professional errors can create — which varies significantly by industry and the size of client engagements. A freelance designer whose client engagements produce $50,000 to $100,000 in annual fees has a different professional liability exposure than a management consultant whose engagements produce $1 million to $5 million in annual fees. The professional liability limit should reflect the realistic worst-case financial harm that a professional error on the largest client engagement could produce — not the average engagement value but the maximum engagement value that represents the worst realistic scenario.


    The Cost Comparison That Helps Right-Size the Budget

    The combined cost of general liability and professional liability for a professional service business is typically less than most business owners expect — particularly for home-based or virtual businesses where the general liability exposure is limited and the professional liability exposure is the primary coverage concern.

    A home-based consultant carrying $1 million professional liability and $1 million general liability might pay $600 to $900 per year for the professional liability and $400 to $600 per year for the general liability — a combined annual cost of $1,000 to $1,500 for both coverages. The combined cost is modest relative to the financial exposure each coverage addresses — a professional liability claim on a single client engagement could produce defense costs and a settlement that exceeds multiple years of combined premium payments.


    The professional vs general liability comparison is the foundation for understanding the specific coverage needs of a service business — and knowing how much each coverage costs for specific business types makes the budget planning concrete rather than theoretical. Our guide on how much does small business insurance cost in 2026 — the honest breakdown by industry covers the specific premium ranges for both coverages across the most common small business types, so the budget for each coverage reflects market reality rather than rough estimates.


    Currently carrying only general liability for a business that provides professional services — or carrying only professional liability without general liability and wondering whether the gap matters for the specific operations? Leave a comment with your business type, the services you provide, and whether you have a physical office or client-facing location. We’ll help you determine which coverage combination addresses the actual exposure your specific business faces.