Category: Home Insurance

  • How to Lower Your Insurance Premium Without Reducing Your Coverage — 11 Legal Strategies That Actually Work

    How to Lower Your Insurance Premium Without Reducing Your Coverage — 11 Legal Strategies That Actually Work

    The instinct to reduce insurance costs by reducing coverage is the most common and most financially dangerous response to premium increases — because it produces lower monthly costs at the expense of the protection that made the insurance worth buying in the first place. The driver who drops liability limits to save $40 per month, the homeowner who removes replacement cost coverage to reduce the annual premium by $200, and the small business owner who lets a professional liability policy lapse between engagements are all making the same mistake — eliminating protection that was providing genuine value in exchange for savings that will be reversed and exceeded the first time a significant claim occurs without adequate coverage in place.

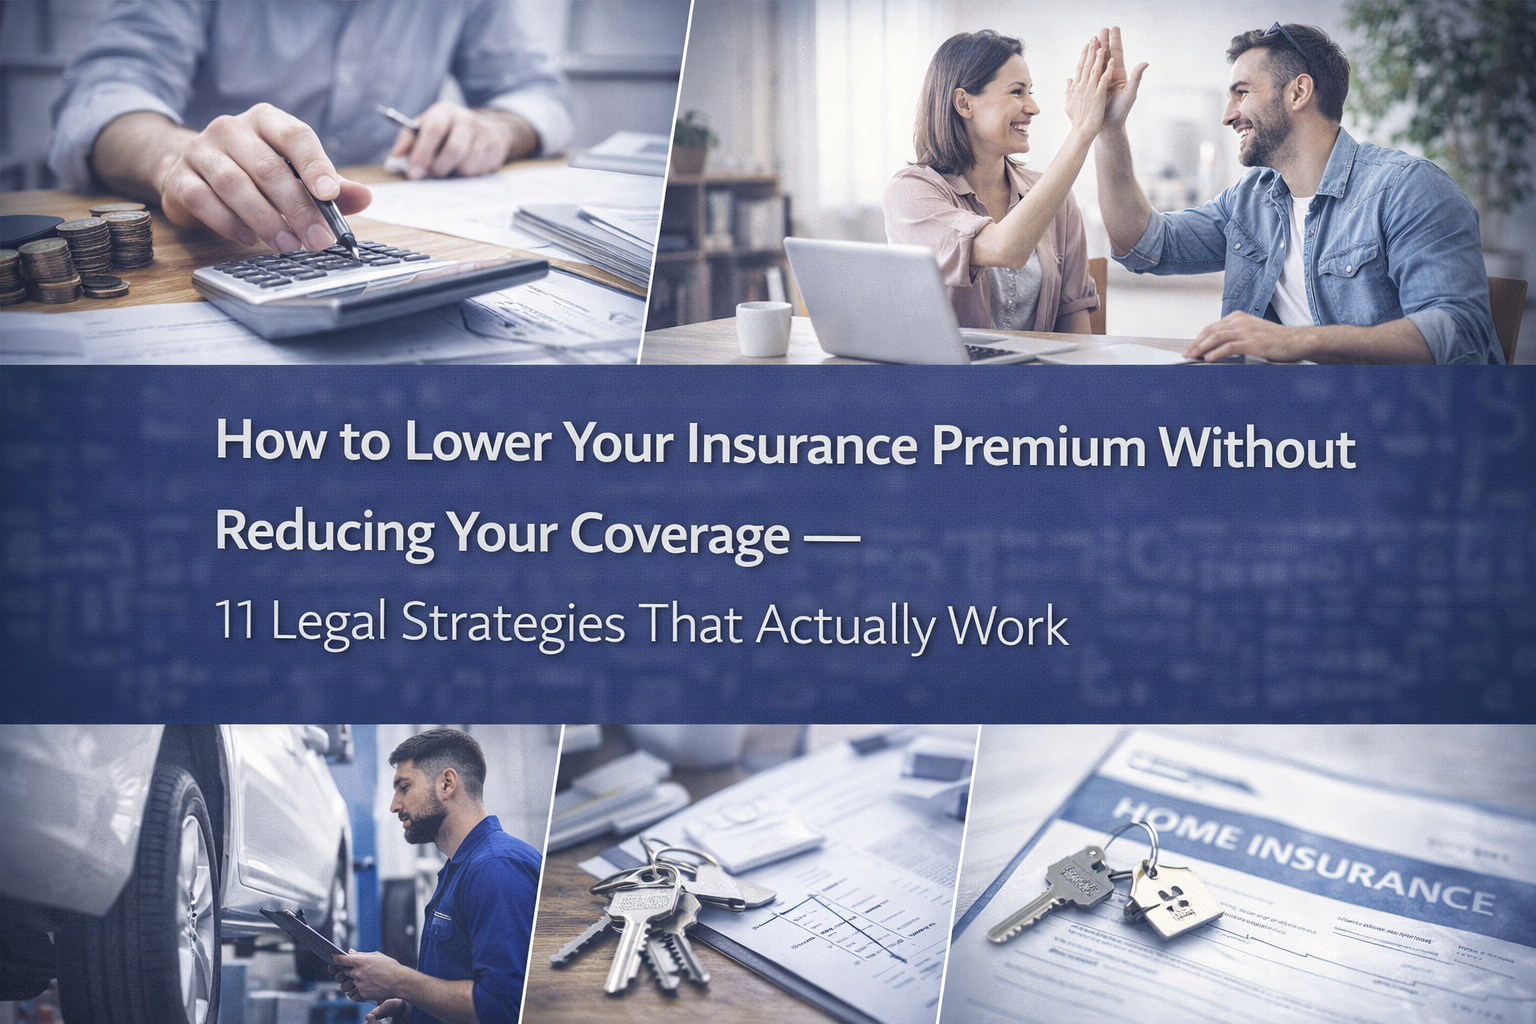
    This guide covers eleven strategies that produce genuine premium reductions without creating coverage gaps — approaches that lower the cost of insurance by reducing the insurer’s risk, improving the information used in rating, or optimizing the coverage structure rather than by reducing the protection the coverage provides.


    Strategy One: Shop Competitively at Every Renewal

    The premium that an insurance company charges at renewal is not necessarily the lowest price available in the market for the same coverage — and the loyalty that most policyholders extend to their current insurer produces a premium that is frequently above what a competitive shopping process would reveal.

    Insurance companies price new business differently from renewal business — new customer acquisition pricing reflects competitive market pressure that renewal pricing doesn’t always match. A policyholder who has been with the same insurer for five years may be paying 15% to 30% more than a new customer with an identical risk profile who switched to the same insurer recently. Shopping coverage at every renewal rather than accepting the renewal premium without comparison produces savings that compound annually for policyholders who find and switch to more competitive alternatives when the differential justifies the switching cost.

    The comparison that produces the most complete picture gets quotes from at least three insurers — including at least one the current insurer doesn’t know is being evaluated — for identical coverage. Identical coverage means the same limits, the same deductibles, the same endorsements, and the same coverage types. A lower premium on different coverage is not a competitive comparison — it’s a coverage trade-off that looks like savings until the coverage difference matters.


    Strategy Two: Raise Deductibles to the Level Your Emergency Fund Supports

    The deductible adjustment is the most direct premium reduction lever available across every insurance category — and the relationship between deductible level and premium is consistent and calculable rather than uncertain. Higher deductibles produce lower premiums. The question is which deductible level produces the best financial outcome for the specific financial situation.

    The correct deductible level is the highest amount that liquid emergency savings can absorb without creating financial hardship — not the highest level available, not the lowest level that feels comfortable, but the amount that reflects the household’s or business’s actual financial resilience at the worst possible moment. A household with $8,000 in accessible emergency savings can rationally carry a $2,500 homeowners deductible — the emergency fund covers the deductible if needed without creating a crisis. The same deductible on a household with $800 in savings produces a payment problem at exactly the moment when the financial pressure of the covered loss is already significant.

    The premium savings from raising deductibles are specific enough to calculate before implementing the change — calling the current insurer and asking for the premium difference between the current deductible and a higher deductible produces the specific savings figure that makes the financial analysis concrete rather than estimated.


    Strategy Three: Bundle Policies With the Same Insurer — But Verify the Math

    The bundling discount — the premium reduction available when multiple policies are purchased from the same insurer — is the most widely advertised insurance saving strategy and the one most frequently accepted without verification that it actually produces net savings.

    The bundling discount is real — typically 5% to 25% on each bundled policy. But whether it produces genuine net savings depends on whether the bundled insurer’s base rates are competitive enough that the discount closes the gap with unbundled alternatives. The insurer offering a 20% bundling discount on homeowners insurance that is 35% more expensive than a competing insurer’s homeowners rate produces a net homeowners cost that is still 15% above the competitor — not savings, despite the advertised discount.

    The verification that most policyholders skip is comparing the total bundled cost against the total unbundled cost of the best available quote for each coverage from the most competitive carrier in each category. When the bundled total is lower, bundle. When the unbundled total is lower, buy each coverage from the most competitive carrier regardless of the bundling discount. The verification takes thirty minutes and produces the correct answer rather than the assumption that bundling always saves money.


    Strategy Four: Improve the Rating Factors That Drive Your Premium

    Insurance premiums are calculated from rating factors that the insurer uses to assess risk — and several of those factors are within the policyholder’s control over time even when they can’t be changed immediately. Improving the controllable rating factors produces premium reductions that compound annually rather than producing a one-time savings.

    Credit score is a rating factor for auto and homeowners insurance in most states — and the relationship between credit improvement and premium reduction is meaningful enough to treat credit improvement as an insurance savings strategy rather than purely a general financial goal. A policyholder who moves from a fair credit tier to a good credit tier may reduce auto insurance premiums by 20% to 40% in states where credit rating is permitted — savings that persist annually rather than requiring repeated action.

    Claims history is the rating factor most directly within the policyholder’s control through the claim filing decision — the choice to file a small claim or pay out of pocket. Every at-fault claim filed creates a claims history record that affects premiums for three to five years. For claims where the recovery is only modestly above the deductible, paying out of pocket preserves the claim-free history and avoids surcharges that may exceed the recovery amount over the surcharge period.

    Driving record affects auto insurance premiums through the violation and accident surcharges that apply for three to five years following the events — surcharges that compound the base rate by 20% to 50% per violation or accident. The premium cost of driving violations extends well beyond the fine and point assessment — modeling the total insurance cost of a speeding ticket over the full surcharge period produces a cost that typically exceeds the fine by a factor of three to five.


    Strategy Five: Claim Every Discount You Qualify For

    The discount gap — the difference between the discounts a policyholder qualifies for and the discounts actually applied to the policy — costs the average policyholder hundreds of dollars annually. Insurers offer discounts willingly but rarely volunteer them proactively — the policyholder who doesn’t ask doesn’t receive discounts that the insurer would apply if asked.

    The systematic discount audit that produces the most complete discount capture asks specifically about each major discount category rather than asking generally whether discounts are available. The categories worth asking about specifically include good driver and claim-free discounts for auto and home, professional and organizational affiliation discounts across all lines, safety device and security system discounts for auto and home, defensive driving course discounts for auto, loyalty discounts for multi-year policyholders, and administrative discounts for paperless billing and autopay enrollment.

    The affinity discount category is the most frequently unclaimed — many employers, professional associations, alumni organizations, and military service organizations have negotiated insurance discounts that members qualify for without knowing the discount exists. Asking the insurer specifically about affiliation discounts for each organizational membership produces the information needed to claim discounts that may not appear in the online quote process without the specific prompt.


    Strategy Six: Eliminate Coverage That No Longer Applies to Your Situation

    The coverage portfolio that was appropriate at an earlier life stage may include coverage types that no longer address genuine financial exposures — and eliminating coverage that doesn’t apply to the current situation produces premium savings without creating coverage gaps because the protection was already providing no practical value.

    Collision and comprehensive coverage on a vehicle whose value has depreciated to the point where the maximum insurance payout — actual cash value minus deductible — is smaller than the annual premium multiplied by the expected holding period is the most common example of coverage that no longer justifies its cost. A vehicle worth $3,500 with a $1,000 deductible and $700 annual collision and comprehensive premium produces a maximum net payout of $2,500 that requires only 3.6 years of premium to exceed — suggesting that self-insuring the remaining vehicle value through emergency savings produces better expected financial outcomes than continuing the coverage.

    Rental car reimbursement coverage on a household with multiple vehicles is coverage that provides minimal practical value — the household can use another vehicle during repairs rather than needing a rental reimbursement. Roadside assistance coverage on a vehicle already covered by a membership service like AAA duplicates a benefit already paid for through the membership fee. Each of these coverage types represents premium spending with limited practical benefit that, when identified specifically, produces savings through elimination rather than through coverage reduction.


    Strategy Seven: Install Safety and Security Features

    The safety and security devices that reduce the probability or severity of covered losses also reduce the premium that insurers charge for the coverage — because the insurer’s expected claim cost is lower for properties and vehicles with effective loss prevention features.

    Home security systems that include professional monitoring produce homeowners insurance discounts of 5% to 20% at most major insurers — reflecting the actuarial reduction in theft claim frequency for monitored properties relative to unmonitored ones. The annual discount typically exceeds the annual monitoring cost for security systems at the lower end of the monitoring fee range, producing a net financial benefit from the security system installation beyond the direct security benefit.

    Vehicle safety features that reduce accident frequency and severity produce auto insurance discounts that vary by insurer and feature type. Anti-lock brakes, airbags, automatic emergency braking, lane departure warning, and blind spot monitoring all produce discounts that reflect the actuarial reduction in accident frequency and injury severity associated with each feature. For vehicles purchased without confirming that available safety discounts are applied to the policy, specifically requesting the safety feature discount review produces savings without any additional investment.

    Business safety programs for workers compensation produce the most significant safety investment return in the insurance cost context — because the experience modification improvement from reduced claims compounds annually across the modification calculation period. A safety investment that reduces workers compensation claims by 30% produces an experience modification improvement that reduces the workers compensation premium by 15% to 20% annually for several years following the claims reduction.


    Strategy Eight: Review Coverage Limits for Accuracy

    Coverage limits that are set above the actual financial exposure they’re designed to protect produce premiums for excess protection that would never be needed — and adjusting limits to reflect the actual exposure eliminates excess premium without reducing the protection that addresses genuine financial risk.

    Life insurance coverage that exceeds the actual income replacement and financial dependency needs produced by the DIME or needs analysis calculation is the most common over-coverage example — the policyholder who purchased $1.5 million in coverage when the needs analysis supports $800,000 is paying premiums for $700,000 in excess coverage that would never produce a benefit beyond what the $800,000 policy provides. Adjusting the coverage to the accurate amount eliminates the excess premium while maintaining the full protection the actual financial dependency requires.

    Personal property coverage on a homeowners or renters policy that is set at a percentage-based default rather than an actual inventory-based calculation may be over or under the actual replacement cost of the contents — and in either direction, correcting the inaccuracy produces either premium savings from reducing excess coverage or better protection from increasing inadequate coverage. The home inventory that produces accurate personal property coverage reflects the actual replacement cost of the contents rather than a formula-based approximation.


    Strategy Nine: Enroll in Usage-Based and Telematics Programs

    Usage-based insurance programs — telematics programs that monitor driving behavior for auto insurance and usage-based pricing for other coverage types — produce premium adjustments based on actual behavior rather than demographic proxies that may overstate the risk for policyholders whose actual behavior is lower-risk than their demographics suggest.

    Auto insurance telematics programs that monitor acceleration, braking, speed, mileage, and time of day produce discounts for drivers whose monitored behavior confirms the low-risk profile that standard underwriting factors don’t fully reflect. A driver whose demographics suggest elevated risk — a young driver, a driver in a high-accident urban area — but whose actual driving behavior is consistently safe may receive telematics discounts that bring the premium to a level that the demographic factors alone would never produce.

    The low mileage discount that applies for drivers who drive fewer miles annually than the insurer’s standard assumption is one of the most straightforward usage-based savings for remote workers, retirees, and others whose annual mileage is significantly below the national average. Reporting actual mileage rather than accepting the default mileage assumption produces a premium that reflects the lower exposure rather than the standard exposure.


    Strategy Ten: Pay Annually and Go Paperless

    The administrative discounts that insurers offer for reducing their processing costs — paperless billing enrollment, automatic payment setup, and annual premium payment rather than monthly installments — are the easiest discounts to claim and the ones most frequently overlooked because they don’t require any underwriting action.

    The annual payment discount eliminates the installment fees that monthly billing adds — typically $3 to $8 per payment — which compounds to $36 to $96 per year on a monthly-pay policy. For policyholders whose cash flow allows the annual payment, the fee elimination produces a guaranteed savings that doesn’t depend on claims experience, market conditions, or insurer decisions. The paperless billing and autopay discounts add modest additional savings — typically $2 to $10 per coverage per year — that accumulate across multiple policies to a meaningful annual amount.


    Strategy Eleven: Conduct an Annual Coverage Audit

    The annual coverage audit — a systematic review of every active insurance policy against current circumstances, current asset values, and current financial exposure — is the strategy that prevents the premium from growing through accumulation of coverage that no longer applies rather than through market price increases.

    The audit identifies three types of coverage inefficiency that compound annually if left unaddressed — excess coverage that insures above the actual financial exposure, redundant coverage that duplicates protection already provided by another policy, and obsolete coverage that addresses risks that no longer exist for the current situation. Each inefficiency represents premium spending that produces no additional protection value and that the audit identifies and eliminates.

    The annual audit also identifies coverage gaps — risks that have emerged through life changes, business growth, or asset acquisition that are not addressed by the current coverage portfolio. Catching gaps before a claim makes them relevant is the protective value of the audit alongside the cost savings from eliminating inefficiencies — together producing a coverage portfolio that is both adequate and efficient rather than either over-insured at too high a cost or under-insured at too high a risk.


    Applying these premium reduction strategies across every insurance category requires knowing which policies to review and how to structure the coverage audit that produces the most complete picture of the current insurance portfolio. Our guide on the complete insurance audit — how to review all your policies once a year and save money every time covers the step-by-step audit process that applies these strategies systematically rather than in isolation, producing the cumulative savings that reviewing each policy independently doesn’t capture as completely.


    Applied one of these strategies and found that the savings were significantly larger or smaller than expected — or tried to negotiate a discount that the insurer declined without a clear explanation of why? Leave a comment with the specific strategy, the coverage type, and what happened. Real experiences with specific discount and savings approaches help other policyholders understand what to expect when applying the same strategy to their own coverage.

  • How to File a Home Insurance Claim Without Getting Lowballed by Your Insurance Company

    How to File a Home Insurance Claim Without Getting Lowballed by Your Insurance Company

    Filing a homeowners insurance claim is the moment the entire insurance relationship is tested — and it’s the moment most policyholders are least prepared for. The premium payments that have been made for years create a reasonable expectation that a covered loss will be paid fully and fairly. The claims process that follows a major loss sometimes produces that outcome automatically and sometimes requires the policyholder to be an informed and persistent advocate for a settlement that reflects the actual loss rather than the settlement the insurer’s initial offer reflects.

    The gap between the initial settlement offer and the full claim value is not always intentional lowballing — sometimes it’s the result of an incomplete inspection, an outdated pricing database, or a missed item that the adjuster didn’t identify. Sometimes it reflects a deliberate offer that tests whether the policyholder will accept less than they’re entitled to. Understanding how the claims process works, what documentation produces the best outcomes, and when and how to push back on inadequate offers produces claim settlements that are closer to the full loss value than the settlements received by policyholders who navigate the process without that understanding.


    The Steps to Take Immediately After a Loss

    The actions taken in the first hours and days after a covered loss affect the claim outcome more than most policyholders realize — and taking those actions correctly before contacting the insurer produces a stronger claim than contacting the insurer first and then trying to reconstruct the documentation that the insurer’s process will require.

    Documenting the damage thoroughly before any cleanup or repair begins is the most important immediate action. Photographs and video of all damage — from multiple angles, in good lighting, with close-up detail shots of specific damage points alongside wide shots that show the full extent and context — create the evidentiary record that supports the claim through every subsequent step. This documentation is most complete and most credible when it’s captured before any repair work has altered the damage — which means resisting the impulse to begin cleanup until the documentation is thorough.

    Preventing further damage after the initial loss is a requirement under most homeowners policies — the policy language typically includes a duty to mitigate that obligates the policyholder to take reasonable steps to prevent additional damage after a covered loss. Covering a damaged roof section with a tarp, extracting standing water before it spreads, boarding broken windows — these temporary protective measures fulfill the mitigation duty while preserving the documented evidence of the original loss. Saving all receipts for emergency mitigation expenses because they’re reimbursable as part of the claim.

    Making an inventory list of all damaged or destroyed personal property before filing the claim — not from memory alone, but by walking through the damaged areas with the damage documentation and listing every item affected — produces a complete personal property claim rather than the partial claim that recall-based inventories typically produce. Items forgotten in the initial inventory that are recalled later require supplemental claims that the insurer may resist more than a complete original claim.


    Understanding the Adjuster’s Role and Motivations

    The insurance adjuster who handles the claim is the most important person in the claims process — and understanding who they are and what motivates their work produces a more effective working relationship than treating the adjuster as either an ally or an adversary.

    Staff adjusters are employees of the insurance company — they receive a salary and potentially performance incentives that may or may not be directly tied to claim settlement amounts. Independent adjusters are contractors hired by insurance companies to handle claims during high-volume periods like major storms — they’re paid per claim rather than by salary, which creates time pressure that can affect the thoroughness of the inspection. Public adjusters are licensed professionals hired by the policyholder rather than the insurer — they work on the policyholder’s behalf and are compensated as a percentage of the claim settlement, which aligns their incentives with maximizing the policyholder’s recovery.

    The adjuster’s role is to investigate the claim, document the damage, determine coverage under the policy, and produce a scope of loss and cost estimate that reflects the covered damage. The adjuster is not inherently adversarial — they have an obligation to evaluate claims fairly under the policy terms. But the adjuster’s estimate reflects their inspection on a specific day, their interpretation of ambiguous coverage language, and the pricing database their software uses — all of which can produce estimates that undervalue the actual loss without deliberate intent to underpay.

    The most effective approach to the adjuster relationship is cooperative and professional — providing complete access to the damage, answering questions accurately, and sharing the documentation collected independently. The disagreements that arise are most effectively addressed through a factual response that identifies specific discrepancies rather than an emotional response that characterizes the adjuster’s estimate as bad faith without evidence.


    The Estimate Review That Most Policyholders Skip

    The insurer’s estimate of the repair or replacement cost is not the final word on the claim value — it’s the starting point for a process that the policyholder has the right to participate in and the ability to challenge through several legitimate mechanisms.

    Reviewing the insurer’s estimate in detail — line by line, comparing each line item against the actual scope of damage documented in the photographs and inventory — identifies discrepancies that a general review misses. Specific issues to look for include items that appear in the damage documentation but not in the estimate, repair methods that are less expensive than the correct restoration approach, labor rates that are below current market rates for the type of work required, and materials specified at lower quality than the original construction or current code requirements mandate.

    Getting an independent contractor estimate — from a licensed contractor with experience in the type of damage being repaired — provides a market-rate cost estimate that can be compared against the insurer’s estimate. When the contractor estimate is significantly higher than the insurer’s estimate, the contractor can document the specific reasons for the difference — which transforms a general disagreement about claim value into a specific factual dispute about line items, methods, and pricing that the insurer must address on its merits.

    The comparison between the insurer’s estimate and the independent estimate is most useful when it’s specific enough to identify exactly where the gap comes from — not just the total difference but which specific line items account for the most significant discrepancies. A $20,000 gap that comes from three specific items — a labor rate that’s $15 per hour below market, a roofing material specified at a lower grade than the original, and an entire structural repair category that was missed in the inspection — is easier to resolve than a general assertion that the estimate is too low.


    The Depreciation Calculation That Affects Actual Cash Value Policies

    For policyholders carrying actual cash value coverage rather than replacement cost coverage, the depreciation calculation that produces the actual cash value payment is a specific point of negotiation that most policyholders accept without review.

    Actual cash value is calculated as replacement cost minus depreciation — where depreciation reflects the age and condition of the damaged item relative to its expected useful life. A ten-year-old roof with a twenty-year expected useful life would be depreciated at 50% of its replacement cost under a straight-line depreciation approach — a $20,000 roof replacement produces a $10,000 actual cash value payment.

    The depreciation schedules that insurance companies use are standardized tables that apply average depreciation rates by item category and age — and average depreciation rates don’t always accurately reflect the specific item’s condition and remaining useful life. A ten-year-old roof that was installed with premium materials, maintained properly, and was in excellent condition before the loss may have a remaining useful life that warrants less depreciation than the average schedule applies. A ten-year-old roof in poor condition may warrant more.

    Challenging the depreciation calculation requires specific evidence about the item’s pre-loss condition — maintenance records, professional inspections, photographs taken before the loss — that support the argument that the depreciation applied is excessive relative to the actual condition. The challenge is not guaranteed to succeed but is more likely to produce an adjustment when it’s supported by specific evidence rather than a general objection to the depreciation amount.


    When to Hire a Public Adjuster

    The public adjuster question is one that policyholders with complex or large claims — major structural damage, significant personal property losses, business interruption components — should evaluate rather than dismissing as an unnecessary expense.

    Public adjusters are licensed professionals who specialize in preparing and negotiating insurance claims on behalf of policyholders. They perform their own inspection and documentation of the damage, prepare a detailed scope of loss that identifies every covered item and its replacement cost, submit that scope to the insurer, and negotiate the settlement on the policyholder’s behalf. Their fee is typically 10% to 15% of the claim settlement — which means their cost is directly tied to the settlement they produce.

    The financial case for hiring a public adjuster is strongest when the insurer’s initial offer is significantly below the actual loss value — when the gap between the offer and the correct claim value is large enough that 10% to 15% of the improved settlement exceeds the cost of self-advocacy. Research on public adjuster outcomes consistently shows that claims handled by public adjusters settle for higher amounts than policyholder-negotiated settlements — though the fee reduces the net improvement to the policyholder.

    For small and straightforward claims — a single damaged appliance, a small roof section, a broken window — the public adjuster fee represents a disproportionate cost relative to the potential improvement in settlement. For large and complex claims — a major fire, a significant storm event with extensive structural damage, a claim that involves multiple coverage components — the expertise a public adjuster brings to the documentation and negotiation process can produce improvements that substantially exceed the fee.


    The Appraisal Process for Disputed Claims

    When the policyholder and the insurer cannot reach agreement on the claim value through the standard negotiation process, most homeowners policies include an appraisal provision that provides a structured dispute resolution mechanism without requiring litigation.

    The appraisal process works as follows — each party selects their own independent appraiser, the two appraisers select a neutral umpire, and the three parties evaluate the disputed items. An agreement between any two of the three — the two appraisers or either appraiser and the umpire — produces a binding determination of the claim value. The appraisal process is specifically designed to resolve valuation disputes rather than coverage disputes — it determines how much the covered loss is worth, not whether the loss is covered.

    Invoking the appraisal provision requires following the specific procedural steps outlined in the policy — typically a written demand that identifies the disputed items and requests the appraisal process. The demand should be made before accepting any partial payment that might be characterized as a full settlement of the disputed items, because partial payment acceptance can affect the ability to invoke appraisal for the remaining disputed amount.

    The costs of the appraisal process — each party pays their own appraiser, and both parties share the umpire’s costs equally — are real but typically modest relative to the claim amount in dispute. The appraisal process is faster and less expensive than litigation for resolving valuation disputes, and the binding determination it produces provides resolution without the uncertainty and cost of a court proceeding.


    The Documentation Habit That Prevents Every Future Claim Problem

    The single most effective preparation for any future homeowners insurance claim is the home inventory — the systematic record of everything the home contains, with purchase information, current values, and photographic evidence, stored outside the home in a location that survives the same event that damages the home.

    Creating a home inventory before a loss is the difference between filing a claim based on documented evidence of what existed and filing a claim based on recalled items that are increasingly difficult to reconstruct accurately as time passes and stress impairs memory. Insurance companies pay claims based on evidence — a home inventory provides the evidence that supports every personal property claim component rather than requiring reconstruction from memory after a loss.

    The most practical home inventory format for most homeowners is a combination of video walkthrough — a narrated video of each room that captures visible items with commentary about brands and approximate values — and a written or spreadsheet record of significant items with purchase receipts, serial numbers, and appraisal documents for high-value items. The video walkthrough takes approximately an hour for a typical home and produces the most comprehensive immediate record. The written record supplements the video with the specific detail that the video doesn’t capture clearly.

    Storing the home inventory in a cloud service — Google Drive, iCloud, Dropbox — ensures that the inventory survives any physical loss at the home itself, which is the scenario where it’s most needed and where a physical-only record would be lost alongside the items it documents.


    Filing a home insurance claim correctly is one piece of the homeowners insurance picture — making sure the policy structure is right before a claim occurs is the other. Our guide on how much homeowners insurance do you actually need covers the coverage limit calculation that determines whether a claim results in full recovery or a financial gap, so the claim process that this guide covers produces the settlement your home actually deserves.


    Have you filed a homeowners insurance claim and found that the insurer’s initial offer was significantly below what you ultimately received — or navigated a disputed claim through appraisal or public adjuster representation? Leave a comment with the specific situation and how it resolved. Real claims experiences are the most useful information available for homeowners who haven’t yet faced this process.

  • Renters Insurance Explained: Why It Costs Less Than a Netflix Subscription and Covers More Than You Think

    Renters Insurance Explained: Why It Costs Less Than a Netflix Subscription and Covers More Than You Think

    Renters insurance is the most consistently undervalued insurance product available — a coverage that costs less per month than most streaming subscriptions, protects tens of thousands of dollars in personal belongings, and provides liability protection that most renters don’t realize they need until the moment they need it. The proportion of renters who carry renters insurance remains significantly below the proportion who would benefit from it — a gap that reflects not a deliberate decision to self-insure but a combination of not knowing the coverage exists, assuming the landlord’s insurance covers tenant belongings, and underestimating the value of personal property that would need to be replaced after a loss.

    This guide covers what renters insurance actually provides, what it costs, and why the decision to go without it is almost never financially rational once the coverage is understood rather than assumed.


    The Landlord Insurance Misconception That Leaves Most Renters Unprotected

    The most common reason renters give for not carrying renters insurance is the assumption that the landlord’s insurance covers them — an assumption that is consistently and completely wrong in ways that produce genuinely devastating financial consequences when a loss occurs.

    The landlord’s insurance covers the building — the physical structure, the roof, the walls, the plumbing, the electrical system, and the landlord’s fixtures and appliances. It does not cover the tenant’s belongings inside that building. A fire that damages the apartment building is covered by the landlord’s policy for the structural damage. The tenant’s furniture, clothing, electronics, and everything else in the apartment are not covered by the landlord’s policy under any circumstances — they are the tenant’s responsibility, and the only insurance that covers them is a renters insurance policy in the tenant’s own name.

    The misconception extends to liability — most renters assume that if someone is injured in their apartment, the landlord’s insurance covers the resulting claim. The landlord’s liability insurance covers injuries that result from the landlord’s negligence — a building defect, a common area hazard, a maintenance failure. Injuries that occur in the tenant’s apartment from conditions the tenant controls — a guest who trips over the tenant’s belongings, a friend burned by a stovetop accident — are the tenant’s liability responsibility. Without renters insurance, that liability falls entirely on the tenant personally.


    What Renters Insurance Actually Covers

    Renters insurance provides three categories of protection that together address the primary financial risks that renters face — and understanding all three categories produces a more accurate picture of the coverage’s value than focusing on personal property protection alone.

    Personal property coverage is the most visible component — the protection for furniture, clothing, electronics, appliances, and other belongings against damage from covered perils including fire, theft, vandalism, windstorm, and water damage from plumbing failures. The covered perils for renters insurance personal property are typically the same named perils that homeowners policies apply to personal property — broader than the everyday risks that produce the most claims and narrower than the all-risk coverage that homeowners dwelling policies provide for the structure.

    The personal property coverage extends beyond the apartment walls in a way that most renters don’t know about — belongings stolen from a vehicle, a laptop stolen from a coffee shop, or luggage stolen from a hotel room are typically covered under the renters policy’s personal property coverage at the same limits and deductibles as items stolen from the apartment itself. This off-premises theft coverage turns the renters policy into a portable personal property protection that follows the insured wherever their belongings go rather than protecting only items at the insured address.

    Liability coverage protects the renter against legal claims from third parties — a guest injured in the apartment, an accidental fire the renter causes that damages neighboring units, a dog bite that occurs on the property, or a child’s accident that results in a neighbor’s property damage. The standard liability limit on a renters policy is typically $100,000 — which is adequate for most routine liability scenarios but may be worth increasing for renters whose lifestyle or activities create elevated liability exposure.

    Loss of use coverage — sometimes called additional living expenses — pays for temporary housing and living expenses when a covered loss makes the insured apartment uninhabitable. A fire that damages the apartment severely enough to require the tenant to vacate during repairs triggers the loss of use coverage for hotel costs, restaurant meals above the normal food budget, and other additional expenses that the displacement creates. This coverage is particularly valuable in markets where temporary housing costs are high — a renter displaced from a $1,200 per month apartment in a market where comparable temporary housing costs $150 per night has a meaningful financial exposure that the loss of use coverage addresses.


    What Renters Insurance Costs and Why the Price Is This Low

    The premium for renters insurance is consistently surprising to people who haven’t previously purchased it — not because it’s higher than expected but because it’s lower. The national average for renters insurance is approximately $15 to $20 per month — less than most streaming service subscriptions and less than most people spend on coffee per week.

    The low premium reflects the actuarial reality of the coverage — the insurance company is covering personal property that is inside a structure whose structural protection the landlord’s insurance covers and whose fire suppression and security systems the landlord maintains. The risk that renters insurance is pricing is primarily the theft and fire risk to personal property in a residence — a risk that is meaningfully lower per dollar of coverage than the combined structural and content risk that homeowners insurance prices.

    The factors that affect the specific premium a renter pays are consistent with the broader insurance pricing factors — the total personal property coverage amount, the deductible selected, the location of the apartment and its associated crime and weather risk, and any endorsements added to cover specific high-value items. A renter who selects $30,000 in personal property coverage with a $500 deductible in a low-crime area might pay $12 to $15 per month. The same renter with $50,000 in coverage in a higher-crime urban area with a lower deductible might pay $20 to $30 per month. The variation is real but the range remains modest relative to the protection provided.

    The payment structure that produces the lowest annual cost is typically the annual payment — paying twelve months of premium upfront rather than monthly eliminates the installment fees that monthly billing adds and sometimes produces a small discount from the insurer. For a coverage that costs $15 to $20 per month, the annual payment of $180 to $240 is accessible for most renters and produces the lowest total annual cost.


    The Personal Property Calculation That Most Renters Underestimate

    The most important decision in renters insurance is selecting the personal property coverage limit — and it’s a decision that most renters make based on a rough guess rather than an actual inventory of the belongings that would need to be replaced after a total loss.

    The exercise that consistently reveals how significantly most renters underestimate the value of their belongings is the room-by-room replacement cost calculation — mentally walking through each room and estimating what it would cost to replace each significant item at current retail prices with a comparable new equivalent. This calculation produces totals that surprise most renters because the replacement cost of accumulated belongings is consistently higher than the intuitive estimate.

    The bedroom alone — mattress and bed frame, dresser and nightstands, clothing and shoes across all seasons, jewelry, a laptop, a phone, a tablet, and various accessories — commonly totals $8,000 to $20,000 in replacement cost depending on the quality of the items. The living room adds a sofa, chairs, coffee and side tables, a television, entertainment system components, and any decorative items. The kitchen adds small appliances, cookware, and pantry items. By the time a renter walks through every room honestly, the total frequently reaches $20,000 to $50,000 — a number that both justifies a meaningful personal property coverage limit and reveals how financially devastating an uninsured total loss would be.

    The replacement cost versus actual cash value distinction is particularly important for renters insurance — because renters who select actual cash value coverage rather than replacement cost coverage discover at claim time that the depreciated value of their belongings is significantly less than what it costs to replace them with comparable new items. A five-year-old laptop with an actual cash value of $200 costs $1,200 to replace with a comparable current model — the $1,000 gap is the renter’s personal cost if the policy only covers actual cash value. Selecting replacement cost coverage eliminates this gap at a modest premium increase that is consistently worth the additional cost.


    The Liability Coverage That Most Renters Overlook

    The liability coverage in renters insurance is the component that most renters are least aware of and that produces the most unexpected value when a claim occurs. The scenario that reveals the liability coverage’s value most clearly is also the one that most renters consider least likely — until it happens.

    A renter whose guest trips and falls in the apartment, sustaining injuries that require medical treatment and produce lost wages during recovery, faces a liability claim that can reach tens of thousands of dollars. Without renters insurance, that claim is the renter’s personal financial responsibility — payable from savings, income, or in the worst case from a judgment that garnishes wages for years. With renters insurance, the liability coverage pays the medical expenses, legal defense costs, and any settlement up to the policy limit — protecting the renter’s savings and income from an event that was accidental and that most people would never anticipate creating significant financial liability.

    The dog ownership scenario is among the most common liability situations that renters insurance addresses — and one that landlords increasingly require renters insurance to cover specifically because dog bite liability claims are among the most expensive in personal liability. A dog bite that requires medical treatment, produces a scar, or results in significant injury can produce a claim of $30,000 to $100,000 or more. Renters insurance with a $100,000 liability limit covers that claim rather than leaving the dog owner personally responsible for the judgment.


    What Renters Insurance Doesn’t Cover

    Understanding the exclusions in renters insurance is as important as understanding the coverage — because the perils that renters policies exclude are sometimes the ones that produce the most significant losses in specific locations and situations.

    Flood damage is excluded from renters insurance exactly as it is from homeowners insurance — the same surface water inundation definition applies, and the damage from flooding to the renter’s personal property is not covered under the standard renters policy. Renters in ground-floor units, basement apartments, or areas with flooding history face meaningful exposure from this exclusion — private renters flood insurance is available from some carriers and addresses this gap for renters in flood-prone locations.

    Earthquake damage is excluded from standard renters policies in all states — the same exclusion that applies to homeowners applies to renters, and separate earthquake coverage is available as an endorsement or standalone policy for renters in seismic risk areas.

    Roommate’s belongings are not covered under a renters policy unless the roommate is listed as an insured on the policy. A renter who assumes that their policy covers a roommate’s laptop or furniture is mistaken — each tenant should carry their own renters policy or be explicitly added to a joint policy for their belongings to be covered.

    High-value items above the standard sublimits require scheduled endorsements exactly as they do under homeowners policies — jewelry, fine art, collectibles, and musical instruments that exceed the standard sublimits need individual scheduled coverage to be fully protected.


    The Landlord Requirement That Makes the Decision for Many Renters

    An increasing proportion of landlords now require renters insurance as a lease condition — a requirement that has expanded significantly over the past decade as landlords have recognized both the liability protection that renters insurance provides for their own properties and the financial protection it provides for tenants who might otherwise be unable to recover from a significant loss.

    The landlord requirement for renters insurance typically specifies a minimum liability coverage amount — commonly $100,000 — and requires the tenant to provide a certificate of insurance naming the landlord as an interested party. The certificate requirement ensures that the landlord receives notification if the policy lapses or is cancelled — which protects the landlord’s interest in ensuring continuous coverage throughout the tenancy.

    For renters whose landlord requires renters insurance, the coverage decision is already made — the question is which policy to purchase rather than whether to purchase. For renters whose landlord doesn’t require it, the financial case for purchasing it remains compelling on the merits regardless of the requirement — the combination of affordable premium, broad personal property protection, liability coverage, and loss of use benefits makes renters insurance one of the most cost-effective insurance purchases available to anyone paying rent.


    Renters insurance covers the belongings inside the apartment — but if you’re thinking about moving from renting to owning, the coverage picture changes significantly. Our guide on the best homeowners insurance companies in 2026 covers the insurers worth considering when the transition to homeownership means moving from renters insurance to the more comprehensive — and more complex — homeowners coverage that protecting a property you own requires.


    Currently renting without renters insurance and now reconsidering after reading this — or already carrying renters insurance and wondering whether your personal property limit actually reflects the value of what you’d need to replace? Leave a comment with your situation and we’ll help you figure out whether your current coverage is adequate or whether an adjustment makes sense.

  • What Homeowners Insurance Covers and What It Doesn’t — The Gaps That Surprise People Most

    What Homeowners Insurance Covers and What It Doesn’t — The Gaps That Surprise People Most

    Homeowners insurance is sold as comprehensive protection for one of the largest financial assets most people own — and it is comprehensive, but only within boundaries that the policy defines precisely and that most policyholders never read carefully until a claim reveals a boundary they didn’t know existed. The gap between what homeowners believe their policy covers and what it actually covers is narrower for routine claims and dramatically wider for the specific events that produce the most financially devastating losses.

    Understanding what a standard homeowners policy actually covers — and equally important, what it specifically excludes — is the kind of information that’s most useful before a loss rather than after one. The homeowner who reads their policy’s exclusions section before the first major storm has time to purchase the additional coverage those exclusions create a need for. The same homeowner who reads those exclusions after a flood has damaged their home has the information too late to act on it.


    What a Standard Homeowners Policy Actually Covers

    A standard homeowners insurance policy — the HO-3 form that covers the vast majority of owner-occupied single-family homes — provides coverage across four broad categories that together address the most common losses homeowners face.

    Dwelling coverage protects the physical structure of the home — the walls, roof, floors, built-in appliances, and attached structures like garages and decks — against damage from covered perils. The HO-3 policy form covers the dwelling on an open perils basis, which means it covers all causes of loss except those specifically excluded rather than requiring the loss to result from a named peril on a defined list. Open perils coverage is broader than the named perils coverage that older HO-1 and HO-2 forms provided, and it’s the coverage standard that most modern homeowners policies meet.

    Other structures coverage extends protection to detached structures on the property — freestanding garages, fences, sheds, guest houses, and pool enclosures. The standard limit for other structures coverage is 10% of the dwelling coverage limit — a $400,000 dwelling limit produces $40,000 in other structures coverage. For properties with significant detached structures whose replacement cost exceeds the standard 10% allocation, increasing the other structures limit is worth evaluating.

    Personal property coverage protects the contents of the home — furniture, clothing, electronics, appliances, and other belongings — against damage from covered perils. Unlike the dwelling, personal property is typically covered on a named perils basis in the standard HO-3 form, which means the loss must result from a specific cause listed in the policy rather than any cause not excluded. The named perils that standard policies cover for personal property include fire, lightning, windstorm, hail, theft, vandalism, and several others — but not every cause of loss that dwelling coverage addresses.

    Liability coverage protects the homeowner against legal claims arising from bodily injury or property damage that occurs on the property or that results from the homeowner’s activities. A guest who slips on an icy walkway, a neighbor’s child injured by a trampoline, a contractor who falls from a ladder while working on the property — each of these scenarios can produce a liability claim that the homeowners policy’s liability coverage addresses up to the policy limit. Medical payments coverage — a separate component of the liability section — pays small medical expenses for guests injured on the property regardless of fault, which resolves minor injury claims without requiring a formal liability proceeding.


    The Flood Exclusion That Surprises the Most Homeowners

    The single most financially consequential exclusion in a standard homeowners insurance policy is the flood exclusion — and it’s the exclusion that produces the most genuine shock at claim time because the word flood carries a common usage meaning that doesn’t match the insurance definition.

    In common usage, a flood is any significant water intrusion — a pipe bursts and water floods the basement, a storm overwhelms the gutters and water floods the first floor, a river rises and water floods the neighborhood. In insurance usage, flood is specifically defined as surface water inundation from external sources — water that accumulates on normally dry land from overflow of inland or tidal waters, unusual and rapid accumulation of surface runoff, or mudflow. This specific definition excludes the insured’s home from coverage when surface water from any external source — rising river, storm surge, overland flooding from heavy rain — enters and damages the structure.

    The financial magnitude of the flood exclusion is significant because flooding is one of the most common and most expensive natural disasters affecting American homes. The Federal Emergency Management Agency estimates that just one inch of floodwater can cause $25,000 in damage to a typical home — and major flooding events regularly produce losses that total hundreds of thousands of dollars for affected properties. Homes in high-risk flood zones face this risk annually rather than occasionally, but flooding events regularly affect properties outside designated high-risk zones — approximately 40% of FEMA flood insurance claims come from properties outside high-risk flood areas.

    The coverage that addresses the flood exclusion is a separate flood insurance policy — either through the National Flood Insurance Program, which is the government-backed flood insurance program that provides coverage in participating communities, or through private flood insurers that have entered the market with competitive products in recent years. The NFIP provides up to $250,000 in dwelling coverage and $100,000 in personal property coverage — limits that are adequate for many homes but that may be insufficient for higher-value properties where private flood insurance with higher limits is worth evaluating.


    The Earthquake Exclusion That Affects More Homeowners Than They Realize

    Earthquake damage is excluded from standard homeowners policies in all states — a surprising exclusion for homeowners who don’t live in California or the Pacific Northwest, where earthquake risk is most visible, but who live in areas with seismic activity that doesn’t receive the same public attention as the major fault zones.

    The New Madrid Seismic Zone — which affects parts of Missouri, Illinois, Tennessee, Arkansas, Kentucky, and Mississippi — has produced some of the most powerful earthquakes in North American recorded history and continues to generate seismic activity that poses meaningful risk to homes in the region. The Wasatch Front in Utah, the Charleston, South Carolina area, and the Pacific Northwest outside California all carry earthquake risk that standard homeowners policies exclude regardless of whether the homeowner is aware of the local seismic history.

    Earthquake insurance is available as a standalone policy or as an endorsement to the homeowners policy in most markets — with premiums that reflect the specific seismic risk of the property’s location. In high-risk areas like the San Francisco Bay Area, earthquake insurance premiums are significant and deductibles are typically expressed as a percentage of the dwelling coverage rather than a fixed dollar amount — a 15% deductible on a $500,000 dwelling represents a $75,000 out-of-pocket cost before coverage begins. In lower-risk areas, earthquake insurance premiums are more modest and the protection addresses a meaningful if less probable risk.


    The Maintenance and Wear Exclusion That Affects the Most Claims

    The exclusion that affects more homeowners insurance claims than any other — and that produces the most frustration among policyholders who expected a different outcome — is the maintenance and wear exclusion that prevents homeowners policies from covering damage resulting from deferred maintenance, gradual deterioration, and normal wear.

    A roof that leaks because it’s reached the end of its serviceable life and was never replaced is a maintenance issue — the homeowners policy doesn’t cover the water damage resulting from a worn-out roof because the damage resulted from neglect rather than a covered peril. A plumbing system that fails because pipes have corroded over decades of use is a maintenance issue — the resulting water damage may or may not be covered depending on whether the failure is characterized as sudden and accidental or as gradual deterioration. A foundation that cracks and settles over years of soil movement is a maintenance issue — the structural damage is excluded from coverage regardless of how significant it becomes.

    The coverage that standard homeowners policies do provide for water damage involves a specific distinction that claims adjusters evaluate carefully — whether the water damage resulted from a sudden and accidental event or from gradual seepage and deterioration. A pipe that bursts suddenly and releases water that damages floors and walls is typically covered. The same pipe that has been slowly leaking for months and has caused gradual damage to the subfloor is typically not covered, because the gradual deterioration that allowed the leak to develop constitutes a maintenance failure rather than a sudden and accidental loss.

    Understanding the sudden and accidental standard helps homeowners both in preventing coverage denials — addressing maintenance issues before they cause gradual damage that the policy won’t cover — and in documenting claims — describing a covered event in terms that reflect its sudden and accidental nature rather than its gradual development.


    The Sewer and Drain Backup Exclusion That Catches Homeowners Off Guard

    Water damage from sewer backup — when the municipal sewer system or the home’s lateral line becomes overwhelmed or blocked and sewage reverses into the home through drains — is excluded from standard homeowners policies despite being one of the most common and most unpleasant water damage scenarios homeowners face.

    The distinction between sewer backup and water damage from a burst pipe is a coverage distinction that seems arbitrary from the homeowner’s perspective — both result in water damage to the interior of the home — but that reflects a difference in the cause of the loss that the policy treats as fundamental. A burst pipe is a sudden and accidental failure of a covered structure. A sewer backup is water entering from an external system through the plumbing — a scenario that the standard homeowners policy excludes.

    Sewer and drain backup coverage is available as an endorsement to most homeowners policies at an additional premium that typically ranges from $50 to $150 per year — modest relative to the potential loss, which can include not just structural damage but the cost of cleaning and sanitizing a home affected by sewage intrusion. For homeowners in areas with aging municipal sewer infrastructure, homes with older lateral lines, or properties in locations that experience heavy rainfall events that overwhelm sewer capacity, the sewer backup endorsement is among the most cost-effective additions available.


    The Business Activity Exclusion That Affects Home-Based Businesses

    The growing number of homeowners who operate businesses from their homes — whether full-time home-based businesses, freelance and consulting operations, or the occasional client meeting at the kitchen table — face a coverage gap that most don’t know exists until a business-related claim reveals it.

    Standard homeowners policies exclude or significantly limit coverage for business property and business liability. Business equipment — computers, specialized tools, inventory — may be excluded entirely or covered at a sublimit that’s inadequate for significant business property. Business liability — a client injured during a visit to the home office, a professional mistake that causes financial harm to a client — is typically excluded from homeowners liability coverage because it’s a commercial exposure rather than a personal one.

    The coverage solutions for home-based business owners include a home business endorsement that extends the homeowners policy to include business property and limited business liability, an in-home business policy that provides more comprehensive coverage for larger home-based operations, and a separate commercial general liability policy for professional liability exposures that the homeowners policy can’t address.


    The High-Value Item Sublimits That Leave Significant Coverage Gaps

    Standard homeowners policies apply sublimits to specific categories of high-value personal property — limits within the overall personal property coverage that cap the payment for items in those categories regardless of the total personal property coverage available.

    The sublimits that most commonly affect homeowners are the jewelry sublimit — typically $1,500 to $2,500 for theft of jewelry — the firearms sublimit, the electronics sublimit, and the cash sublimit. A homeowner with $20,000 in jewelry who files a theft claim receives $1,500 to $2,500 from the standard policy rather than $20,000 — regardless of the total personal property coverage limit on the policy.

    Scheduled personal property endorsements — riders that list specific high-value items with individual coverage amounts — eliminate the sublimit problem for items whose value exceeds the standard sublimits. Each scheduled item receives its own coverage limit, is typically covered on an all-risk basis that’s broader than the named perils standard personal property coverage, and is often covered without a deductible. The premium for scheduled personal property endorsements is based on the value of the scheduled items and the category — jewelry is priced differently from fine art, which is priced differently from musical instruments.


    Understanding what your homeowners policy doesn’t cover is as important as understanding what it does — and knowing how to file a claim correctly when a covered loss does occur is the next piece of the coverage picture. Our guide on how to file a home insurance claim without getting lowballed by your insurance company covers the specific steps that produce the most complete claim recovery, including the documentation and negotiation approaches that make a meaningful difference in the final settlement.


    Have you had a homeowners insurance claim denied or limited because of an exclusion you didn’t know existed — or discovered a gap in your coverage before a loss occurred and had time to address it? Leave a comment with the specific exclusion and the situation. Real coverage gap discoveries help other homeowners identify whether the same gap exists in their own policies.

  • How Much Homeowners Insurance Do You Actually Need — The Calculation Most People Get Wrong

    How Much Homeowners Insurance Do You Actually Need — The Calculation Most People Get Wrong

    The homeowners insurance coverage limit that most people carry was set at some point during the home purchase process — often in the final days before closing when attention was divided across a dozen simultaneous decisions — and has been renewed at approximately the same level ever since without a serious review of whether it still reflects what the home would actually cost to rebuild. That gap between what a policy covers and what rebuilding would actually require has become one of the most expensive coverage mismatches in personal insurance, driven by construction cost increases that have outpaced the automatic inflation adjustments that most policies apply annually.

    Understanding how to calculate the coverage your home actually needs — not the coverage that seemed adequate when the policy was issued, not the coverage that matches the home’s market value, and not the coverage that the mortgage lender required as a minimum — produces a policy that actually protects the home rather than one that creates the illusion of protection until a major claim reveals the gap.


    Why Market Value Is the Wrong Number for Homeowners Insurance

    The most common homeowners insurance mistake — and the one that produces the most financially devastating claim outcomes — is setting the dwelling coverage limit based on the home’s market value rather than its replacement cost. The distinction between these two numbers is fundamental enough that using the wrong one produces a structurally inadequate policy regardless of how carefully everything else is handled.

    Market value is the price a buyer would pay for the property in the current real estate market — a number that reflects the desirability of the location, the condition of comparable properties, local supply and demand dynamics, and critically, the value of the land the home sits on. The land value component of market value is particularly significant in many markets — a $700,000 home in a desirable urban neighborhood might reflect $400,000 in land value and $300,000 in structure value. Insuring that home for $700,000 — the market value — would vastly over-insure the structure while serving no purpose, because insurance doesn’t cover the land. More commonly, using an outdated market value that was set before property values increased would under-insure the structure relative to what rebuilding actually costs.

    Replacement cost is the amount it would cost to rebuild the home from the foundation up using current materials, labor, and construction methods at current prices — without regard for the land value, the market dynamics, or the original purchase price. Replacement cost is the number that homeowners insurance is actually designed to protect, and it’s the number that determines whether a total loss claim produces full recovery or a shortfall that the homeowner must fund personally.


    The Factors That Determine Your Home’s Replacement Cost

    Replacement cost calculation is more complex than most homeowners realize — and more specific to the individual property than the online calculators that produce instant estimates reflect. Understanding the factors that drive replacement cost is essential to evaluating whether any estimate is accurate enough to use as the basis for a coverage decision.

    Square footage is the starting point — the total heated and cooled living space that would need to be rebuilt, measured in the same way a builder would measure it for a construction estimate. This is the floor plan square footage rather than the lot size, and it’s the number that goes into every replacement cost calculation as the primary variable.

    Construction quality determines the cost per square foot that applies to the square footage — and the range between basic and high-quality construction is wide enough to produce dramatically different replacement cost estimates for the same square footage. A 2,000 square foot home built with standard builder-grade materials might cost $180 per square foot to rebuild — $360,000 total. The same square footage with custom millwork, high-end finishes, hardwood floors, and premium fixtures might cost $280 per square foot — $560,000 total. The coverage limit that’s adequate for the first home is grossly inadequate for the second.

    Unique architectural features — vaulted ceilings, custom cabinetry, specialty tile work, curved staircases, ornate exterior details — add replacement cost that standard per-square-foot estimates don’t capture because they’re averages across standard construction rather than estimates for specific features. A home with significant custom architectural elements needs a replacement cost estimate that accounts for those elements specifically rather than applying a standard rate that doesn’t include them.

    Local labor and material costs vary significantly by geography — rebuilding the same home costs different amounts in different markets because construction labor rates, material transportation costs, and local building code requirements vary by location. The replacement cost per square foot in a rural area with lower labor costs and simpler code requirements is genuinely different from the same calculation in an urban area with higher labor costs and more complex permit requirements.


    The Inflation Problem That Caught Homeowners Off Guard

    The replacement cost calculation that was accurate when a policy was issued becomes less accurate with time — because construction costs change, and the rate of change in recent years has been significant enough to create meaningful gaps between existing coverage limits and actual current replacement costs.

    Construction cost inflation has been particularly pronounced since 2020 — driven by lumber price volatility, supply chain disruptions that increased material costs, and labor shortages that elevated construction wages. The National Association of Home Builders’ construction cost index reflects increases of 30% to 50% in many markets between 2020 and 2026 — which means a coverage limit that was adequate in 2020 may represent only 65% to 75% of current replacement cost for the same home.

    Most homeowners policies include an inflation guard feature — an automatic annual adjustment to the coverage limit that attempts to keep pace with construction cost increases. The challenge is that standard inflation guard adjustments of 2% to 4% per year have not kept pace with the actual construction cost increases experienced in many markets. A 3% annual inflation guard applied to a $300,000 coverage limit over six years produces a $358,000 limit — while actual construction costs in many markets increased by $90,000 or more for the same home. The inflation guard provides some protection against coverage erosion but frequently doesn’t provide full protection in periods of elevated construction cost growth.


    How to Calculate Your Home’s Actual Replacement Cost

    The replacement cost calculation that produces a reliable coverage limit follows a process more specific than most homeowners have applied to their coverage — and the process is accessible enough to complete without hiring a professional appraiser for most standard homes.

    The starting point is the insurer’s replacement cost estimator — a tool that most major insurers provide either as part of the quote process or through the policyholder portal. These estimators collect detailed information about the home’s square footage, construction quality, age, features, and local market and apply construction cost data to produce a replacement cost estimate. The accuracy of the estimate depends on the accuracy and completeness of the information provided — which means giving careful, honest answers to every question rather than approximating.

    For older homes and homes with significant custom features, the insurer’s estimator may underestimate replacement cost because the standard database doesn’t adequately capture the cost of rebuilding features that weren’t standard when the home was built. A 1920s craftsman bungalow with original built-in cabinetry, old-growth wood floors, and period-appropriate architectural details would cost significantly more to rebuild to its original quality than a standard replacement cost estimate reflects — because the craftsmen and materials required for authentic restoration are expensive relative to standard construction.

    An independent replacement cost appraisal from a certified residential appraiser who specializes in insurance valuations produces the most accurate replacement cost estimate for complex or high-value homes. The appraisal cost typically runs $300 to $500 — a modest investment relative to the coverage decision it informs and the potential loss it prevents. For homes where the standard insurer estimate seems significantly out of line with the home’s actual construction quality and features, the independent appraisal is worth commissioning before accepting a coverage limit that may prove inadequate.


    The Extended and Guaranteed Replacement Cost Options That Eliminate the Gap

    Even a carefully calculated replacement cost estimate can become inadequate between the time of calculation and the time of a claim — because construction costs continue to change, and a catastrophic event that damages many homes simultaneously drives up construction costs in the affected area through demand surge. The coverage endorsements that address this residual uncertainty are among the most valuable options available in homeowners insurance.

    Extended replacement cost coverage is an endorsement that increases the policy’s coverage limit by a specified percentage — typically 25% to 50% — above the stated dwelling limit. If the dwelling is covered for $400,000 with 25% extended replacement cost, the actual coverage ceiling is $500,000. The endorsement addresses the scenario where rebuilding costs exceed the estimated limit without requiring the policyholder to have predicted the specific cost increase that caused the gap.

    Guaranteed replacement cost coverage eliminates the ceiling entirely — the insurer pays whatever it actually costs to rebuild the home to its pre-loss condition regardless of the policy limit. This is the most comprehensive coverage available for the dwelling and the one that completely eliminates the underinsurance risk that replacement cost calculations leave even when performed carefully. Not every insurer offers guaranteed replacement cost, and the endorsement typically requires the dwelling coverage limit to already reflect a reasonable replacement cost estimate — the guaranteed replacement cost provision is a safety net above a reasonable limit, not a substitute for accurate limit-setting.


    The Personal Property Coverage Calculation That’s Equally Important

    The dwelling coverage limit is the most important homeowners insurance number — but the personal property coverage limit is the second most important, and it’s calculated using the same replacement cost logic rather than the market value logic that produces the most common dwelling coverage mistake.

    Personal property coverage — the portion of the homeowners policy that covers furniture, clothing, electronics, appliances, and other belongings — is often set at a standard percentage of the dwelling coverage limit rather than at a number derived from the actual value of the contents. The standard 50% to 70% of dwelling coverage that most policies apply as the default personal property limit is adequate for some households and significantly inadequate for others.

    The home inventory is the tool that produces an accurate personal property coverage assessment — a systematic list of every significant item in the home with its replacement cost and category. Creating a complete home inventory is a time investment of several hours for a typical home, but it produces the specific number that allows setting the personal property limit accurately rather than accepting a percentage-based default that may not reflect the actual contents.

    High-value items — jewelry, art, musical instruments, collectibles, firearms, electronics — frequently require scheduled personal property endorsements because the standard personal property coverage applies sublimits to specific categories that can be significantly below the actual value of high-value items. A homeowner with $15,000 in jewelry insured under a standard policy with a $1,500 jewelry sublimit has 90% of the jewelry’s value uninsured — a gap that a scheduled jewelry endorsement eliminates at a premium cost that is modest relative to the protection it provides.


    The Liability Coverage Amount That Most Homeowners Underestimate

    The liability coverage in a homeowners policy — which protects the homeowner against claims arising from injuries on the property or damage caused by household members — is set at a default level that most homeowners haven’t reconsidered since the policy was issued. The standard $100,000 liability limit that many basic homeowners policies include is an amount that can be exhausted by a single serious injury claim in a liability environment where medical costs and legal judgments have increased significantly.

    The liability coverage decision for homeowners who have meaningful assets worth protecting — home equity, retirement savings, investment accounts — is better made in the context of the total liability coverage available across all policies rather than the homeowners policy limit in isolation. A personal umbrella policy that extends liability coverage by $1 million or more above the homeowners policy limit provides the most cost-effective liability protection for homeowners whose assets exceed the standard homeowners liability limit — typically at a cost of $150 to $300 per year for $1 million in additional coverage.


    Now that you understand how much coverage your home actually needs, the next important question is what your policy actually covers — and where the gaps that most homeowners don’t discover until a claim occurs actually are. Our guide on what homeowners insurance covers and what it doesn’t — the gaps that surprise people most covers the specific exclusions and coverage limitations that produce the most expensive claim surprises, with enough detail to identify whether any of them apply to your current policy.


    Have you recently reviewed your homeowners coverage limit and discovered that it was significantly below your home’s actual replacement cost — or had a claim experience where the coverage limit turned out to be inadequate? Leave a comment with what you found and how large the gap was. Real examples of underinsurance discoveries help other homeowners understand the stakes of the coverage limit calculation.

  • The Best Homeowners Insurance Companies in 2026 (Honest Rankings With No Affiliate Bias)

    The Best Homeowners Insurance Companies in 2026 (Honest Rankings With No Affiliate Bias)

    Homeowners insurance is the coverage that most people buy once, renew automatically, and think about seriously only when a claim occurs — at which point the quality of the insurer matters more than it did during any of the renewal cycles when the premium was the only number that received attention. The gap between the homeowners insurance shopping experience and the homeowners insurance claims experience is wider than in almost any other insurance category, because the purchase decision happens during a low-stress transaction and the claims experience happens during one of the most stressful events a homeowner can face.

    This guide ranks the homeowners insurance companies worth considering in 2026 based on the criteria that determine claims outcomes rather than advertising appeal — financial strength, claims satisfaction, coverage options, and the pricing competitiveness that makes the insurer sustainable as a long-term relationship rather than just an attractive first-year quote.


    What the Rankings Are Based On

    The homeowners insurance ranking reflects four evaluation criteria that together produce a more complete picture of insurer quality than any single metric.

    Claims satisfaction is the metric that matters most — measured through J.D. Power’s annual homeowners insurance satisfaction study, the National Association of Insurance Commissioners’ complaint ratio database, and the pattern of consumer reviews that describe the specific claims handling behaviors that produce outcomes rather than impressions. An insurer with a high satisfaction score earned that score by paying claims fairly, communicating clearly during the claims process, and resolving disputes without requiring policyholders to hire attorneys to receive what the policy promised.

    Financial strength ratings from AM Best reflect the insurer’s ability to pay claims — particularly relevant for homeowners insurance where a major regional catastrophe can produce thousands of simultaneous claims that test the financial reserves of smaller or less well-capitalized insurers. Every insurer on this list carries an AM Best rating of A or better.

    Coverage breadth covers the range of optional endorsements and coverage features available to customize the policy for specific property types, locations, and risk exposures. Homeowners insurance is not a commodity product despite being sold like one — the coverage differences between a basic policy and a well-structured policy with appropriate endorsements can be the difference between full recovery and a significant coverage gap after a major loss.

    Pricing competitiveness reflects the premium relative to the coverage provided at the insurer’s standard tier — not the promotional pricing that disappears after the first year, but the renewal pricing that represents the actual long-term cost of the insurer relationship.


    Amica Mutual: The Best Overall Homeowners Insurer in 2026

    Amica Mutual has produced the highest homeowners insurance claims satisfaction scores in J.D. Power’s annual study for more consecutive years than any other insurer — a performance record that reflects a genuine operational commitment to claims resolution rather than a favorable year or a successful survey optimization. The mutual ownership structure that aligns Amica’s incentives with policyholder satisfaction rather than shareholder returns has produced a claims culture that policyholders consistently describe as the most positive claims experience they’ve had with any insurer in any category.

    The dividend policy that Amica’s mutual structure enables is a distinctive financial feature — eligible policyholders in Amica’s dividend program receive an annual dividend that returns a portion of the premium when the company’s underwriting results allow. The dividend typically ranges from 5% to 20% of the annual premium depending on the policy year’s underwriting results, producing an effective premium reduction that makes Amica’s net cost more competitive than the quoted premium alone suggests.

    The coverage options available through Amica’s homeowners policies include replacement cost coverage for personal property — which pays what it costs to replace items with new equivalents rather than the depreciated actual cash value that basic policies use — extended replacement cost coverage for the dwelling that covers rebuilding costs that exceed the policy limit by up to 30%, and a range of endorsements for specific high-value items, home business activity, and identity fraud recovery.

    The limitation that affects Amica’s accessibility for some homeowners is geographic availability and the underwriting selectivity that concentrates their book of business in lower-risk properties and locations. Homeowners in high-risk areas — coastal properties, areas with high wildfire exposure, regions with elevated property crime rates — may find Amica’s underwriting criteria exclude their property or produce pricing that doesn’t reflect the satisfaction advantage as clearly as it does for preferred-risk properties.


    Erie Insurance: The Best Regional Option for the Markets It Serves

    Erie Insurance serves twelve states and the District of Columbia — a regional footprint that makes it unavailable to many homeowners but that produces competitive pricing and exceptional service for the markets where it operates. The regional focus allows Erie to develop deep expertise in the specific claims patterns, weather exposures, and construction costs of its operating territory — expertise that produces better-calibrated coverage and more accurate pricing than national insurers applying standardized approaches across dramatically different regional risk environments.

    The claims satisfaction scores that Erie produces in markets where J.D. Power includes it are consistently among the highest in those markets — a performance that reflects the same agent relationship model that produces State Farm’s claims advocacy advantage, combined with the regional expertise that allows Erie’s claims adjusters to apply market-specific knowledge to settlement decisions.

    Erie’s Rate Lock feature — a policy option that prevents premium increases at renewal for reasons other than coverage changes or significant claims — is a distinctive offering that addresses one of the most common homeowners insurance frustrations. Homeowners who have experienced the premium increases that industry-wide loss events and reinsurance cost changes produce at renewal find Erie’s Rate Lock a genuinely valuable feature — though understanding the specific terms and conditions under which the lock applies and doesn’t apply is important before relying on it as a premium stability guarantee.

    The coverage options at Erie include a guaranteed replacement cost option that covers full rebuilding costs regardless of the policy limit — the most comprehensive dwelling coverage available and the option that eliminates the underinsurance risk that replacement cost calculations can leave even when performed accurately at policy inception. For homeowners in areas with volatile construction costs, the guaranteed replacement cost option produces protection that standard replacement cost coverage doesn’t provide regardless of how accurately the limit was set.


    State Farm: The Most Accessible Option for Most Homeowners

    State Farm is the largest homeowners insurer in the United States by market share — a position that reflects both the company’s national availability across virtually every market and the agent network that makes homeowners insurance purchases a relationship transaction rather than a commodity one. For homeowners who value the ability to sit across from an agent who knows their property and their coverage history when a claim occurs, State Farm’s network provides access that national direct insurers can’t replicate.

    The claims satisfaction scores that State Farm produces in homeowners insurance are consistently above the industry average — not at the top of the J.D. Power rankings that Amica typically occupies, but consistently positive enough to reflect a claims culture that produces acceptable outcomes for most policyholders in most claim situations. The agent network’s claims advocacy role — where the policyholder’s local agent is an available advocate during the claims process rather than a salesperson whose relationship ends at policy issuance — contributes to the satisfaction scores by providing a resource that direct insurers don’t offer.

    The pricing at State Farm is competitive for middle-risk properties in most markets — not typically the lowest available quote, but competitive enough that the premium difference from lower-priced alternatives is often within the range that the agent relationship and claims consistency justify. Homeowners who bundle auto and homeowners insurance with State Farm receive a multi-policy discount that improves the pricing competitiveness of both coverages relative to purchasing each separately from the lowest-priced provider in each category.


    Chubb: The Best Option for High-Value Homes

    Chubb occupies a specific market position in homeowners insurance that separates it from the mass-market carriers — it’s the insurer of choice for high-value homes whose replacement costs, contents values, and liability exposures exceed what standard homeowners policies are designed to address. The coverage features, claims handling standards, and underwriting approach at Chubb reflect a product built for properties and policyholders whose insurance needs go beyond what the standard homeowners market addresses.

    The Masterpiece homeowners policy that Chubb offers includes guaranteed replacement cost coverage for the dwelling regardless of the policy limit — the same feature that Erie offers but applied to the high-value home segment where the gap between construction estimates and actual rebuild costs is most consequential. The extended replacement cost guarantee eliminates the coverage gap that leaves homeowners of complex, high-quality properties underinsured even when their coverage limit was set carefully.

    The risk consulting services that Chubb provides to policyholders of high-value homes — including property risk assessments, wildfire preparation consultations, and hurricane preparedness guidance — reflect the insurer’s investment in loss prevention that benefits both the policyholder and the company’s underwriting results. The service model that treats the policyholder relationship as a partnership in risk management rather than a premium collection and claims payment transaction produces a different insurance experience than the standard market provides.

    The pricing at Chubb reflects the coverage breadth, claims handling standards, and service model — premiums that are meaningfully higher than standard market pricing but that represent genuine value for the high-value home segment where the coverage differences between Chubb and standard carriers produce outcomes that standard carriers’ policies can’t match. For homes where the replacement cost is below $500,000 and the contents and liability exposures are within standard limits, the Chubb premium premium is harder to justify against the alternatives.


    USAA: The Best Option for Eligible Military Members and Veterans

    USAA’s homeowners insurance produces the same combination of competitive pricing and exceptional claims satisfaction that characterizes its auto insurance — and for the approximately 13 million households that qualify for membership, it represents the first option to evaluate rather than a comparison point for non-eligible homeowners.

    The claims satisfaction scores that USAA produces in homeowners insurance are consistently among the highest in the industry — reflecting the same member-centric service culture that produces its auto insurance satisfaction performance. The financial strength backing the claims performance is among the strongest of any insurer evaluated — an AM Best rating of A++ (Superior) that reflects reserve adequacy and financial management that outperforms most competitors.

    The pricing that USAA offers homeowners who qualify reflects the actuarial advantage of underwriting a demographically stable, financially responsible member base — premiums that are consistently competitive with or below market rates for equivalent coverage, without the promotional pricing tactics that front-load savings and recover them through renewal increases.


    The Shopping Process That Produces the Right Choice

    The homeowners insurance shopping process that produces the best outcome gets quotes from at least three insurers for identical coverage — the same dwelling limit, the same personal property limit, the same liability limit, and the same deductible — before making any selection based on premium. The coverage comparison that precedes the premium comparison confirms that the quotes are actually comparable rather than reflecting coverage differences that explain the premium differences.

    The coverage comparison step that most homeowners skip is checking whether the dwelling coverage is actual cash value or replacement cost — a distinction that produces dramatically different claim outcomes and that affects the premium comparison significantly. A lower-premium policy that covers the dwelling at actual cash value — paying the depreciated value of damaged structures rather than the cost to repair or replace them — is not a comparable alternative to a higher-premium policy that covers replacement cost, because the coverage is fundamentally different.


    Getting the right homeowners insurer is the first step — making sure the coverage limit actually reflects what your home would cost to rebuild is the second, and it’s the step most homeowners get wrong. Our guide on how much homeowners insurance do you actually need — the calculation most people get wrong covers the specific replacement cost calculation that prevents the underinsurance gap that catches homeowners off guard after a major loss.


    Which homeowners insurer are you currently with — and have you had a claims experience that confirmed or challenged the company’s satisfaction reputation? Leave a comment with the insurer and the claims situation. Real homeowners insurance claims experiences are the most useful information available for evaluating which company’s reputation matches its actual performance.